

This week, we've dived deep into the Bundaberg home property market to keep our readers informed on the latest trends in home prices and rental rates. Here's what you need to know about the thriving Bundaberg market:
Home Prices
The Bundaberg property market continues to show impressive growth across various suburbs. Leading the charge are Bargara and Coral Cove, with significant property value appreciation, indicating a healthy and expanding market with ample opportunities for capital gains.
Bundaberg Home Sales Statistics (June 2023 – June 2024)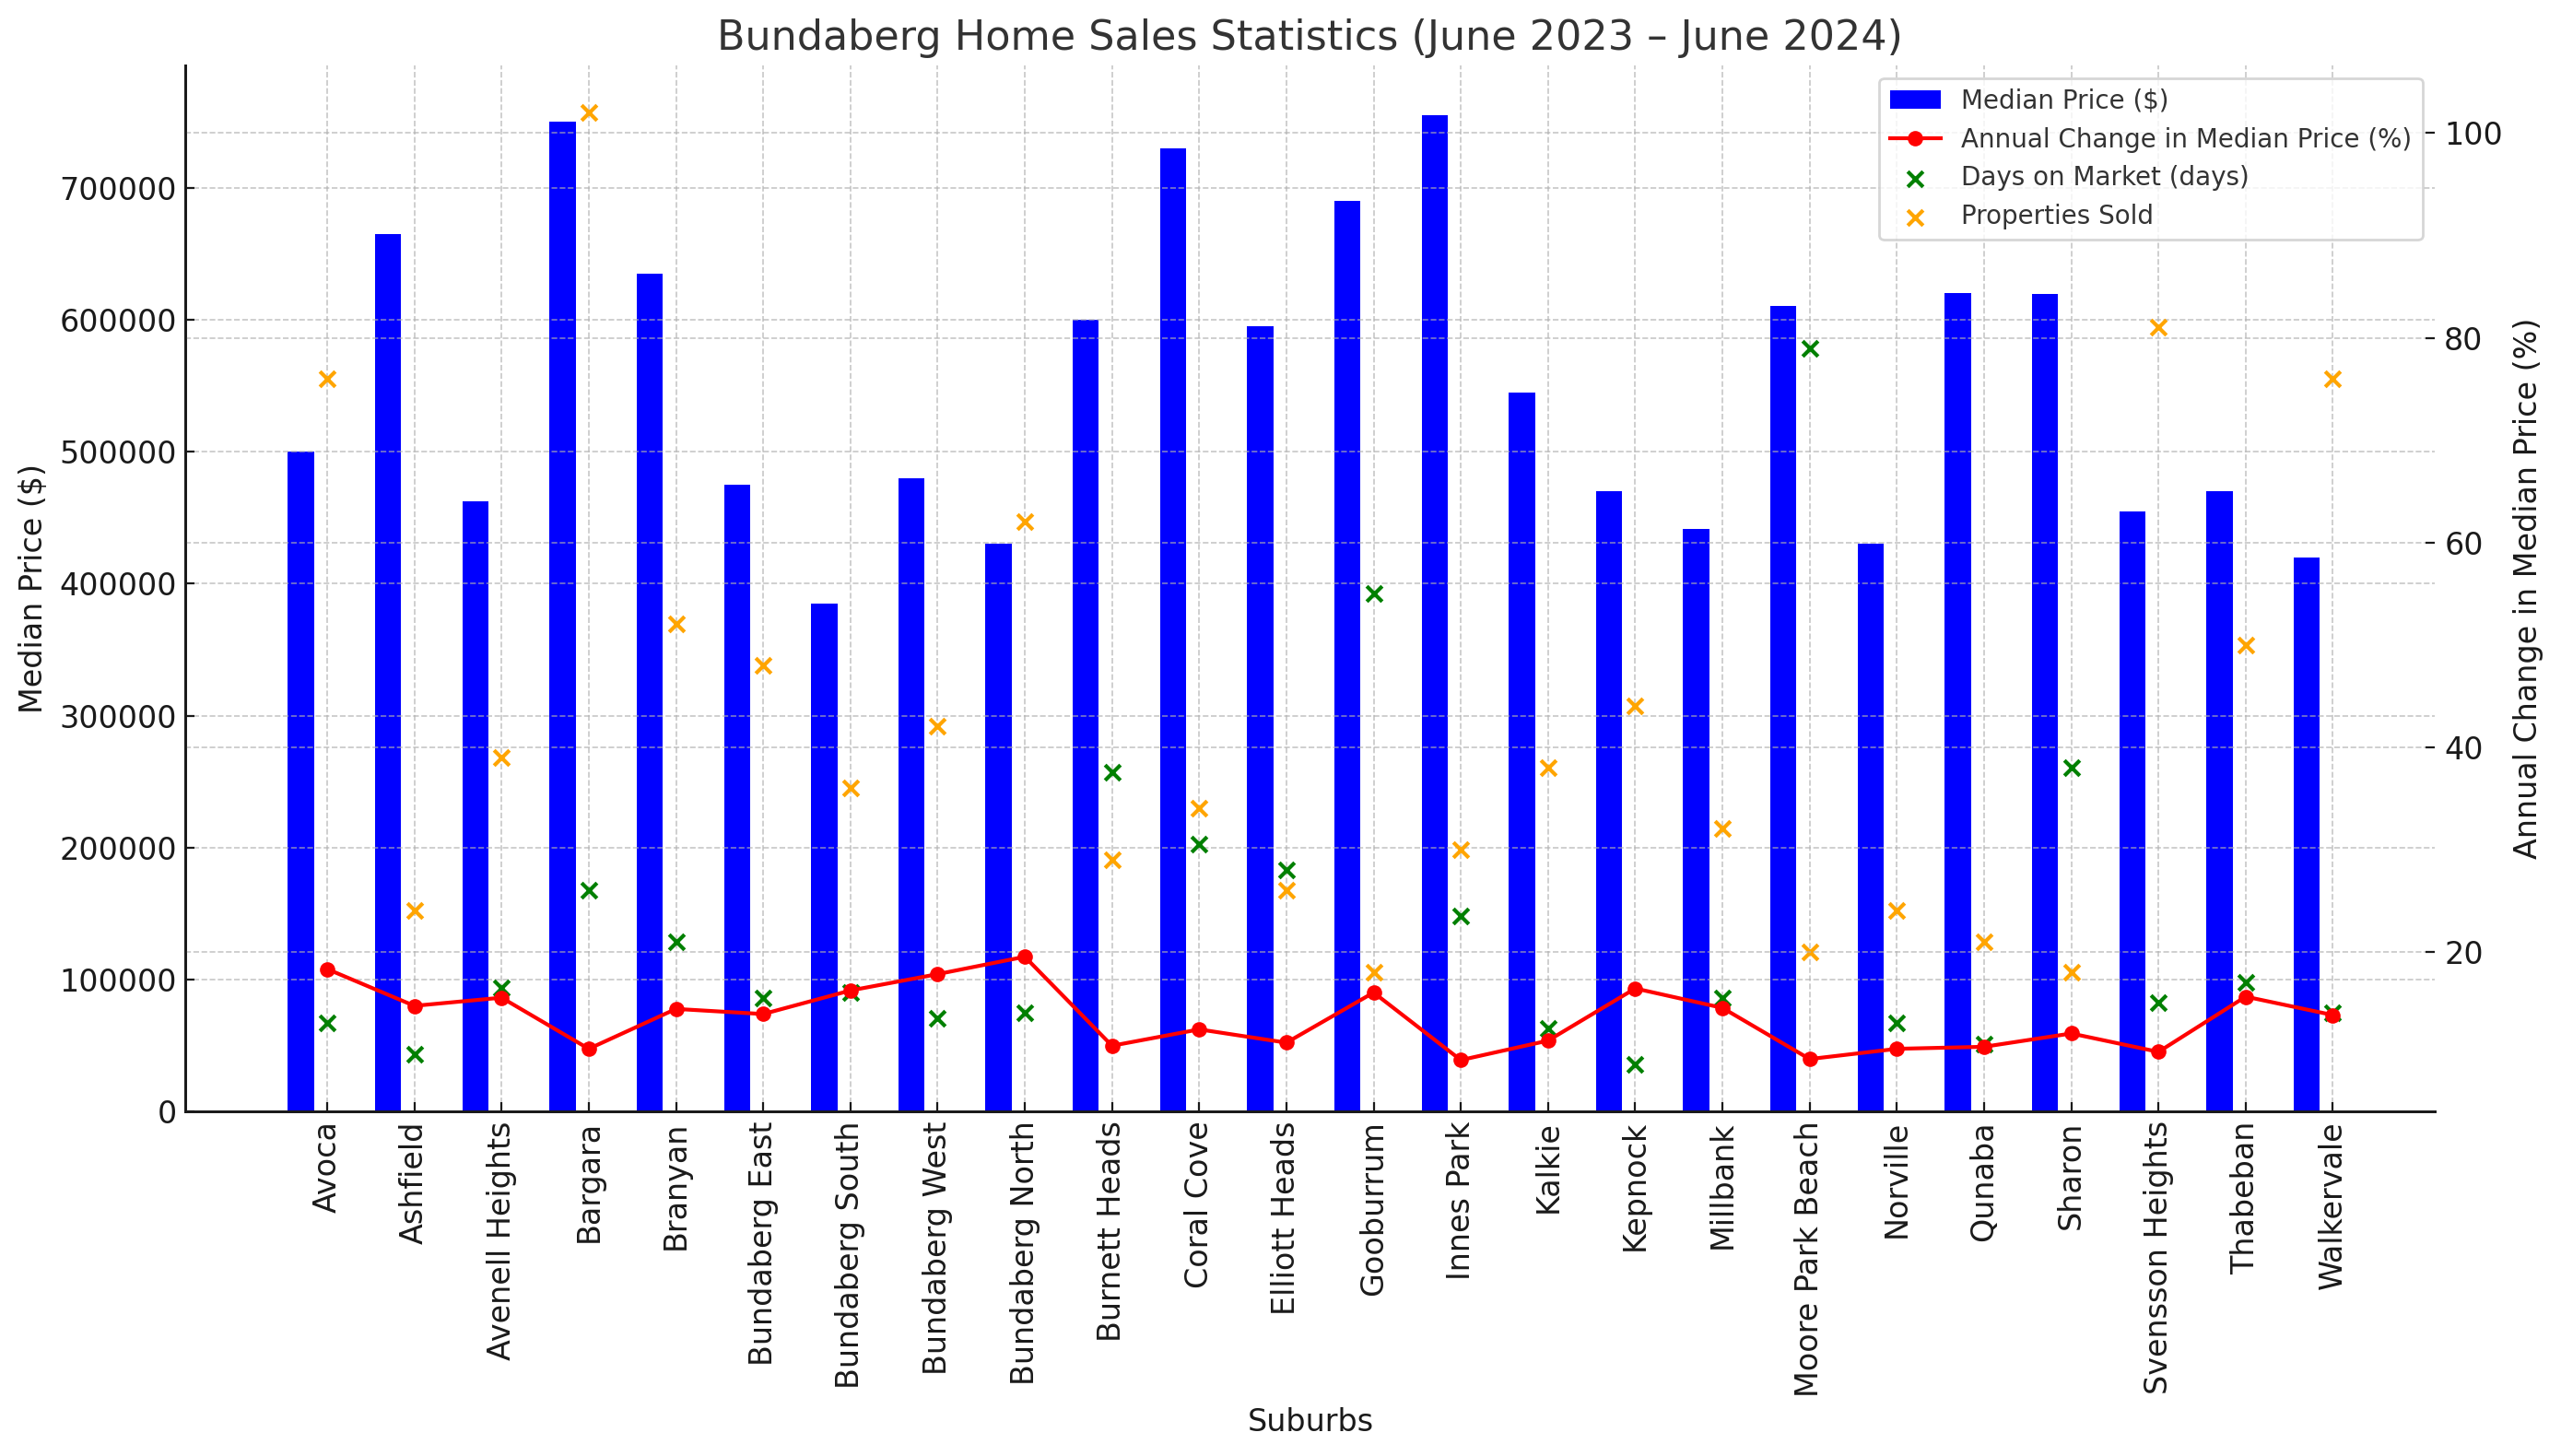 (Click to enlarge)
Suburb – Median Price – Annual Change in Median Price – Days on Market – Properties Sold
Avoca: $500,000 - 18.3% - 13 days - 76 properties sold
Ashfield: $665,000 - 14.7% - 10 days - 24 properties sold
Avenell Heights: $462,375 - 15.5% - 16.5 days - 39 properties sold
Bargara: $750,000 - 10.5% - 26 days - 102 properties sold
Branyan: $635,000 - 14.4% - 21 days - 52 properties sold
Bundaberg East: $475,000 - 13.9% - 15.5 days - 48 properties sold
Bundaberg South: $385,000 - 16.2% - 16 days - 36 properties sold
Bundaberg West: $480,000 - 17.8% - 13.5 days - 42 properties sold
Bundaberg North: $430,000 - 19.5% - 14 days - 62 properties sold
Burnett Heads: $600,000 - 10.8% - 37.5 days - 29 properties sold
Coral Cove: $730,000 - 12.4% - 30.5 days - 34 properties sold
Elliott Heads: $595,000 - 11.1% - 28 days - 26 properties sold
Gooburrum: $690,000 - 16.0% - 55 days - 18 properties sold
Innes Park: $755,000 - 9.4% - 23.5 days - 30 properties sold
Kalkie: $545,000 - 11.3% - 12.5 days - 38 properties sold
Kepnock: $470,250 - 16.4% - 9 days - 44 properties sold
Millbank: $441,750 - 14.5% - 15.5 days - 32 properties sold
Moore Park Beach: $610,000 - 9.5% - 79 days - 20 properties sold
Norville: $430,000 - 10.5% - 13 days - 24 properties sold
Qunaba: $620,000 - 10.7% - 11 days - 21 properties sold
Sharon: $619,750 - 12.0% - 38 days - 18 properties sold
Svensson Heights: $455,000 - 10.2% - 15 days - 81 properties sold
Thabeban: $470,000 - 15.6% - 17 days - 50 properties sold
Walkervale: $420,000 - 13.8% - 14 days - 76 properties sold
Overall, Bundaberg saw a 13.5% growth in home prices from June 2023 to June 2024.
Rental Market Data
Bundaberg's rental market is also on the rise, with significant increases in median rents across various suburbs.
Bundaberg Rental Market Data (June 2023 – June 2024)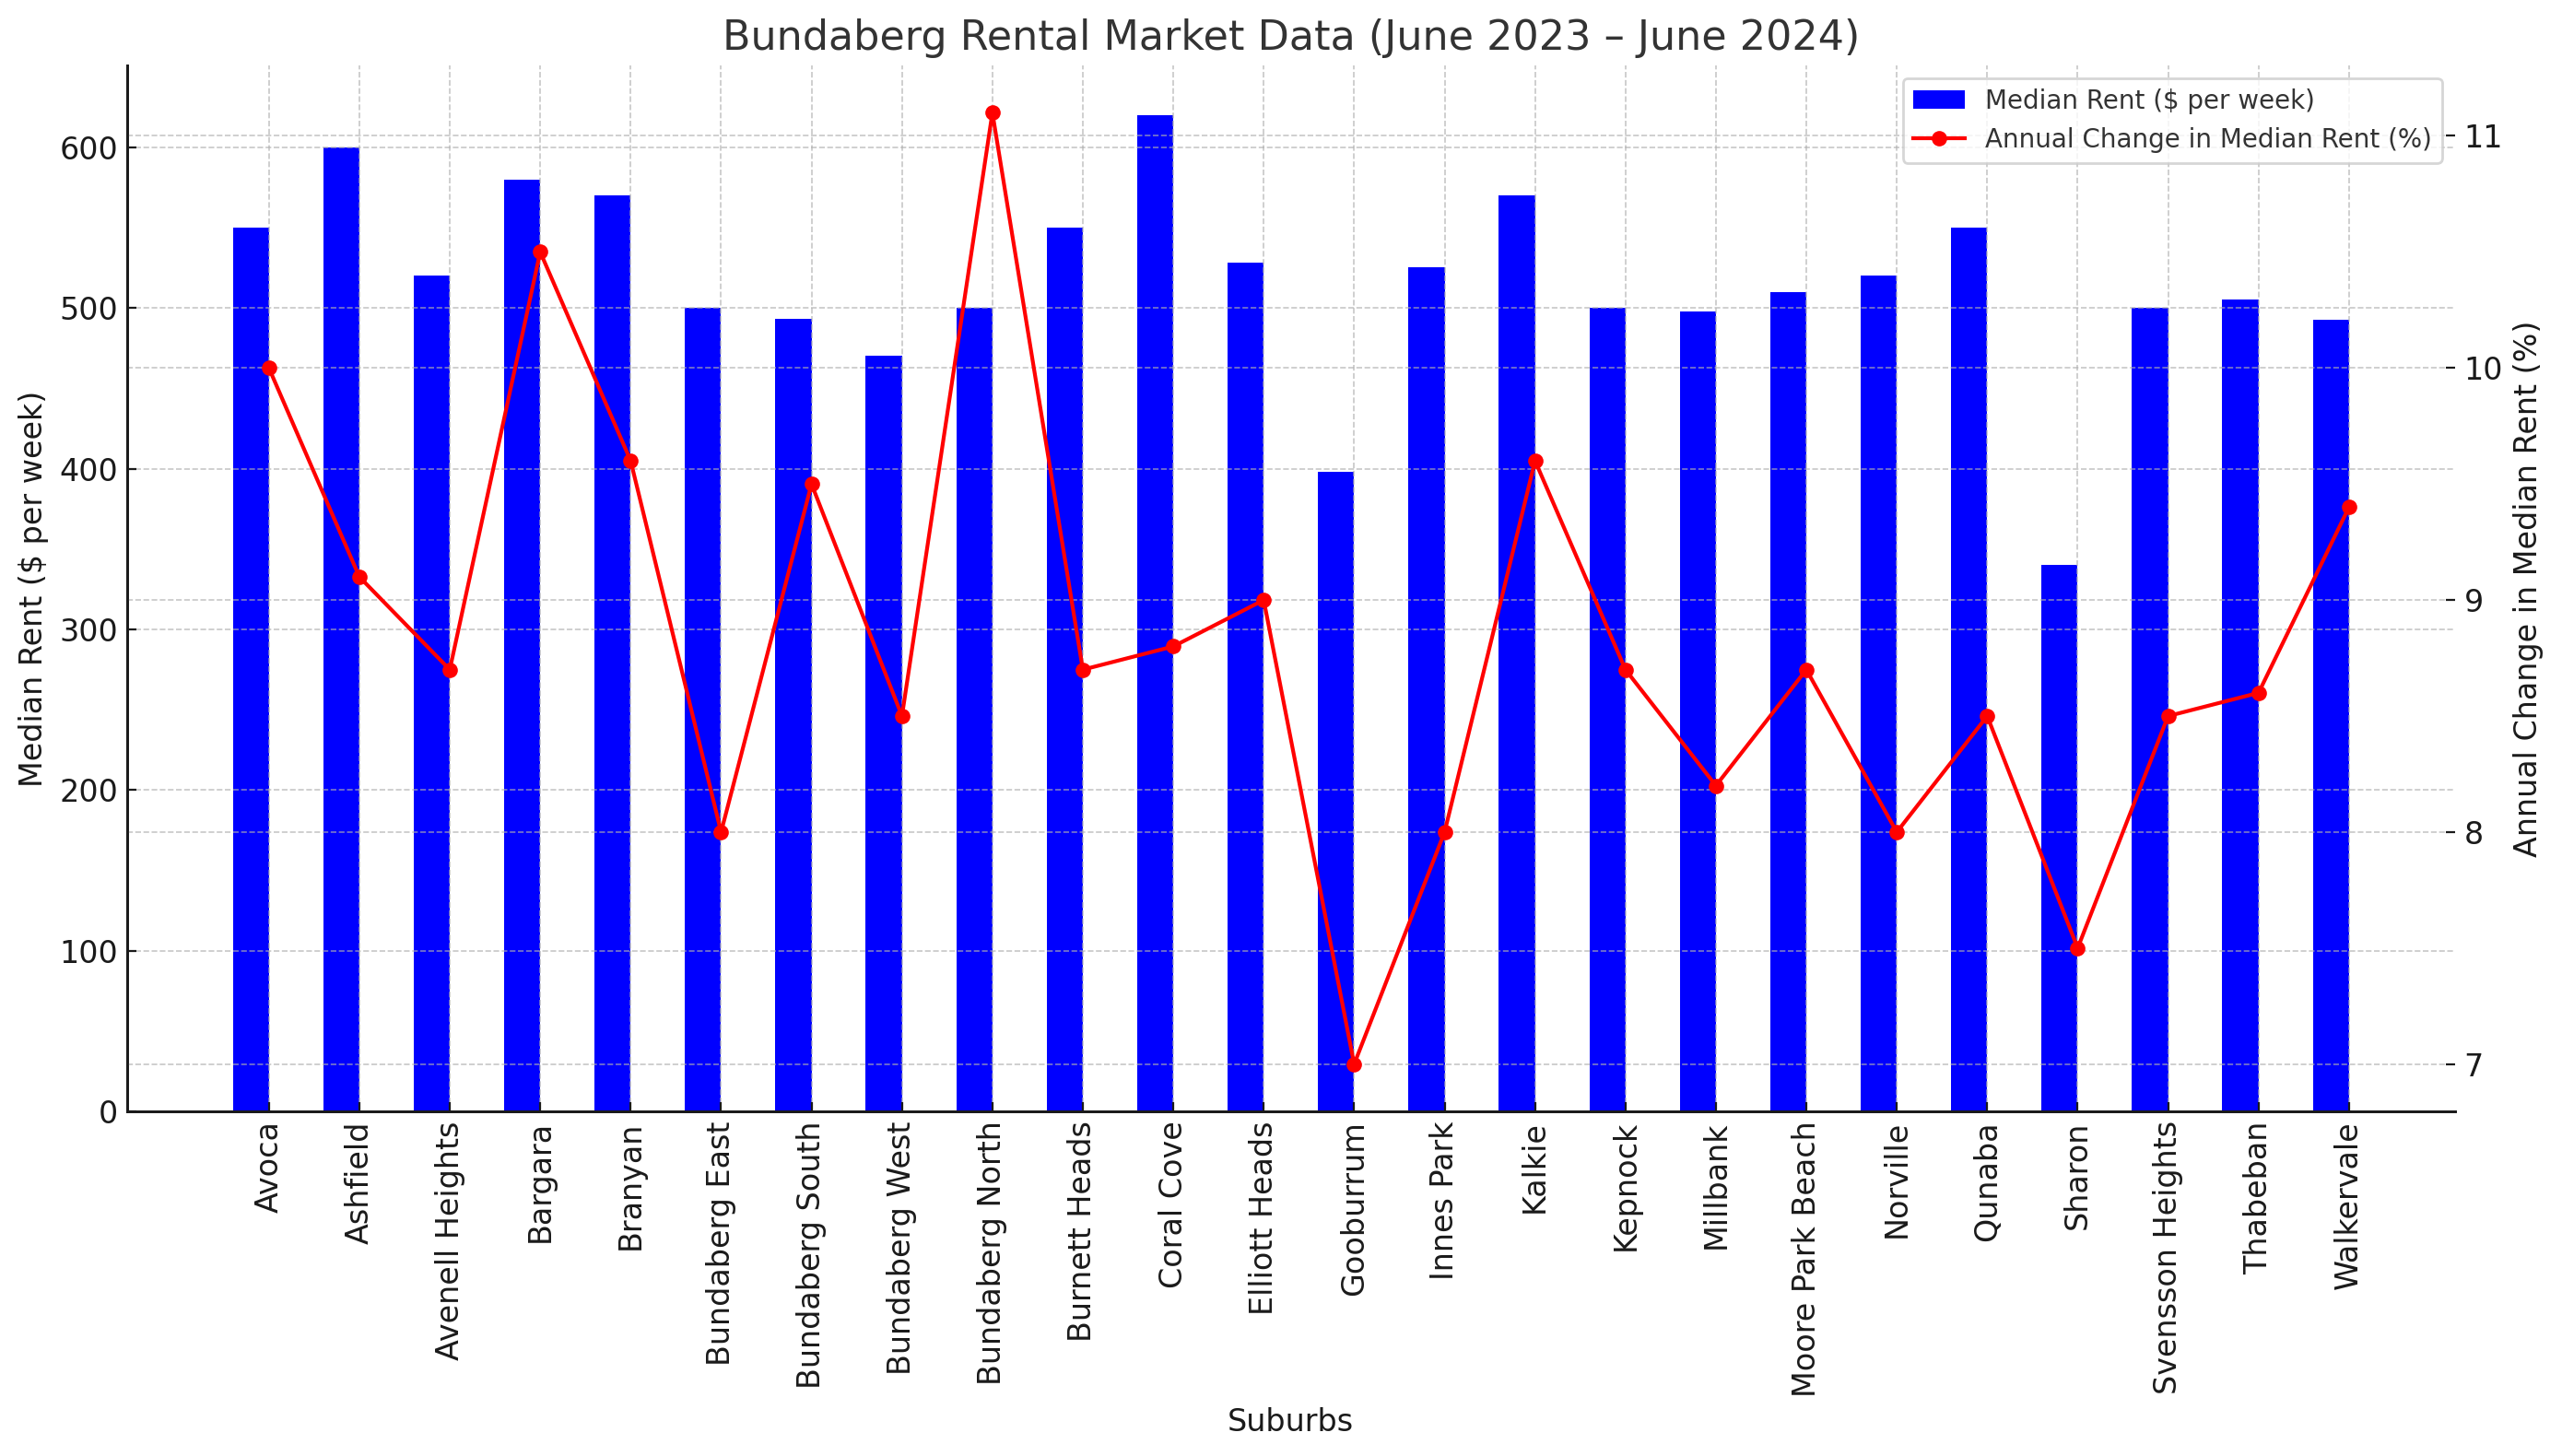 (Click to enlarge)
Suburb - Median Rent - Annual Change in Median Rent
Avoca: $550 per week - 10%
Ashfield: $600 per week - 9.1%
Avenell Heights: $520 per week - 8.7%
Bargara: $580 per week - 10.5%
Branyan: $570 per week - 9.6%
Bundaberg East: $500 per week - 8%
Bundaberg South: $493 per week - 9.5%
Bundaberg West: $470 per week - 8.5%
Bundaberg North: $500 per week - 11.1%
Burnett Heads: $550 per week - 8.7%
Coral Cove: $620 per week - 8.8%
Elliott Heads: $528 per week - 9%
Gooburrum: $398 per week - 7%
Innes Park: $525 per week - 8%
Kalkie: $570 per week - 9.6%
Kepnock: $500 per week - 8.7%
Millbank: $498 per week - 8.2%
Moore Park Beach: $510 per week - 8.7%
Norville: $520 per week - 8%
Qunaba: $550 per week - 8.5%
Sharon: $340 per week - 7.5%
Svensson Heights: $500 per week - 8.5%
Thabeban: $505 per week - 8.6%
Walkervale: $492.5 per week - 9.4%
Overall, the median rent across all listed suburbs increased by approximately 8.73%. This healthy and robust rise in rental prices makes Bundaberg an attractive market for property investors.
Top Suburbs for Property Investors
Based on the combined factors of median home price, median rent, rental yield, and property value growth, the best suburbs for property investors in Bundaberg are:
1. Walkervale: High rental yield (6.10%) and significant annual growth (13.8%).
2. Bundaberg North: High rental yield (6.05%) and the highest annual growth (19.5%).
3. Avoca: Strong rental yield (5.72%) and high annual growth (18.3%).
4. Thabeban: Good rental yield (5.59%) and strong annual growth (15.6%).
5. Kalkie: Solid rental yield (5.44%) and reasonable annual growth (11.3%).
These suburbs offer a winning combination of high rental yields and strong property value growth, making them prime choices for property investors seeking both rental income and capital appreciation.
Stay tuned for more updates and insights into the Bundaberg property market! Whether you're a buyer, seller, landlord, or renter, we're here to help you navigate the market with confidence.