


It's time to take a deep dive into the numbers that shaped the Bundaberg property market in 2024. Whether you’re a homeowner, investor, or thinking about buying or selling in the near future, understanding how the market performed can give you valuable insights into where it’s headed.
From price trends and sales volumes to rental yields and buyer activity, this year's data tells a compelling story about Bundaberg’s real estate landscape. So, how did the market hold up in 2024? Let’s break it all down and see what the stats reveal!
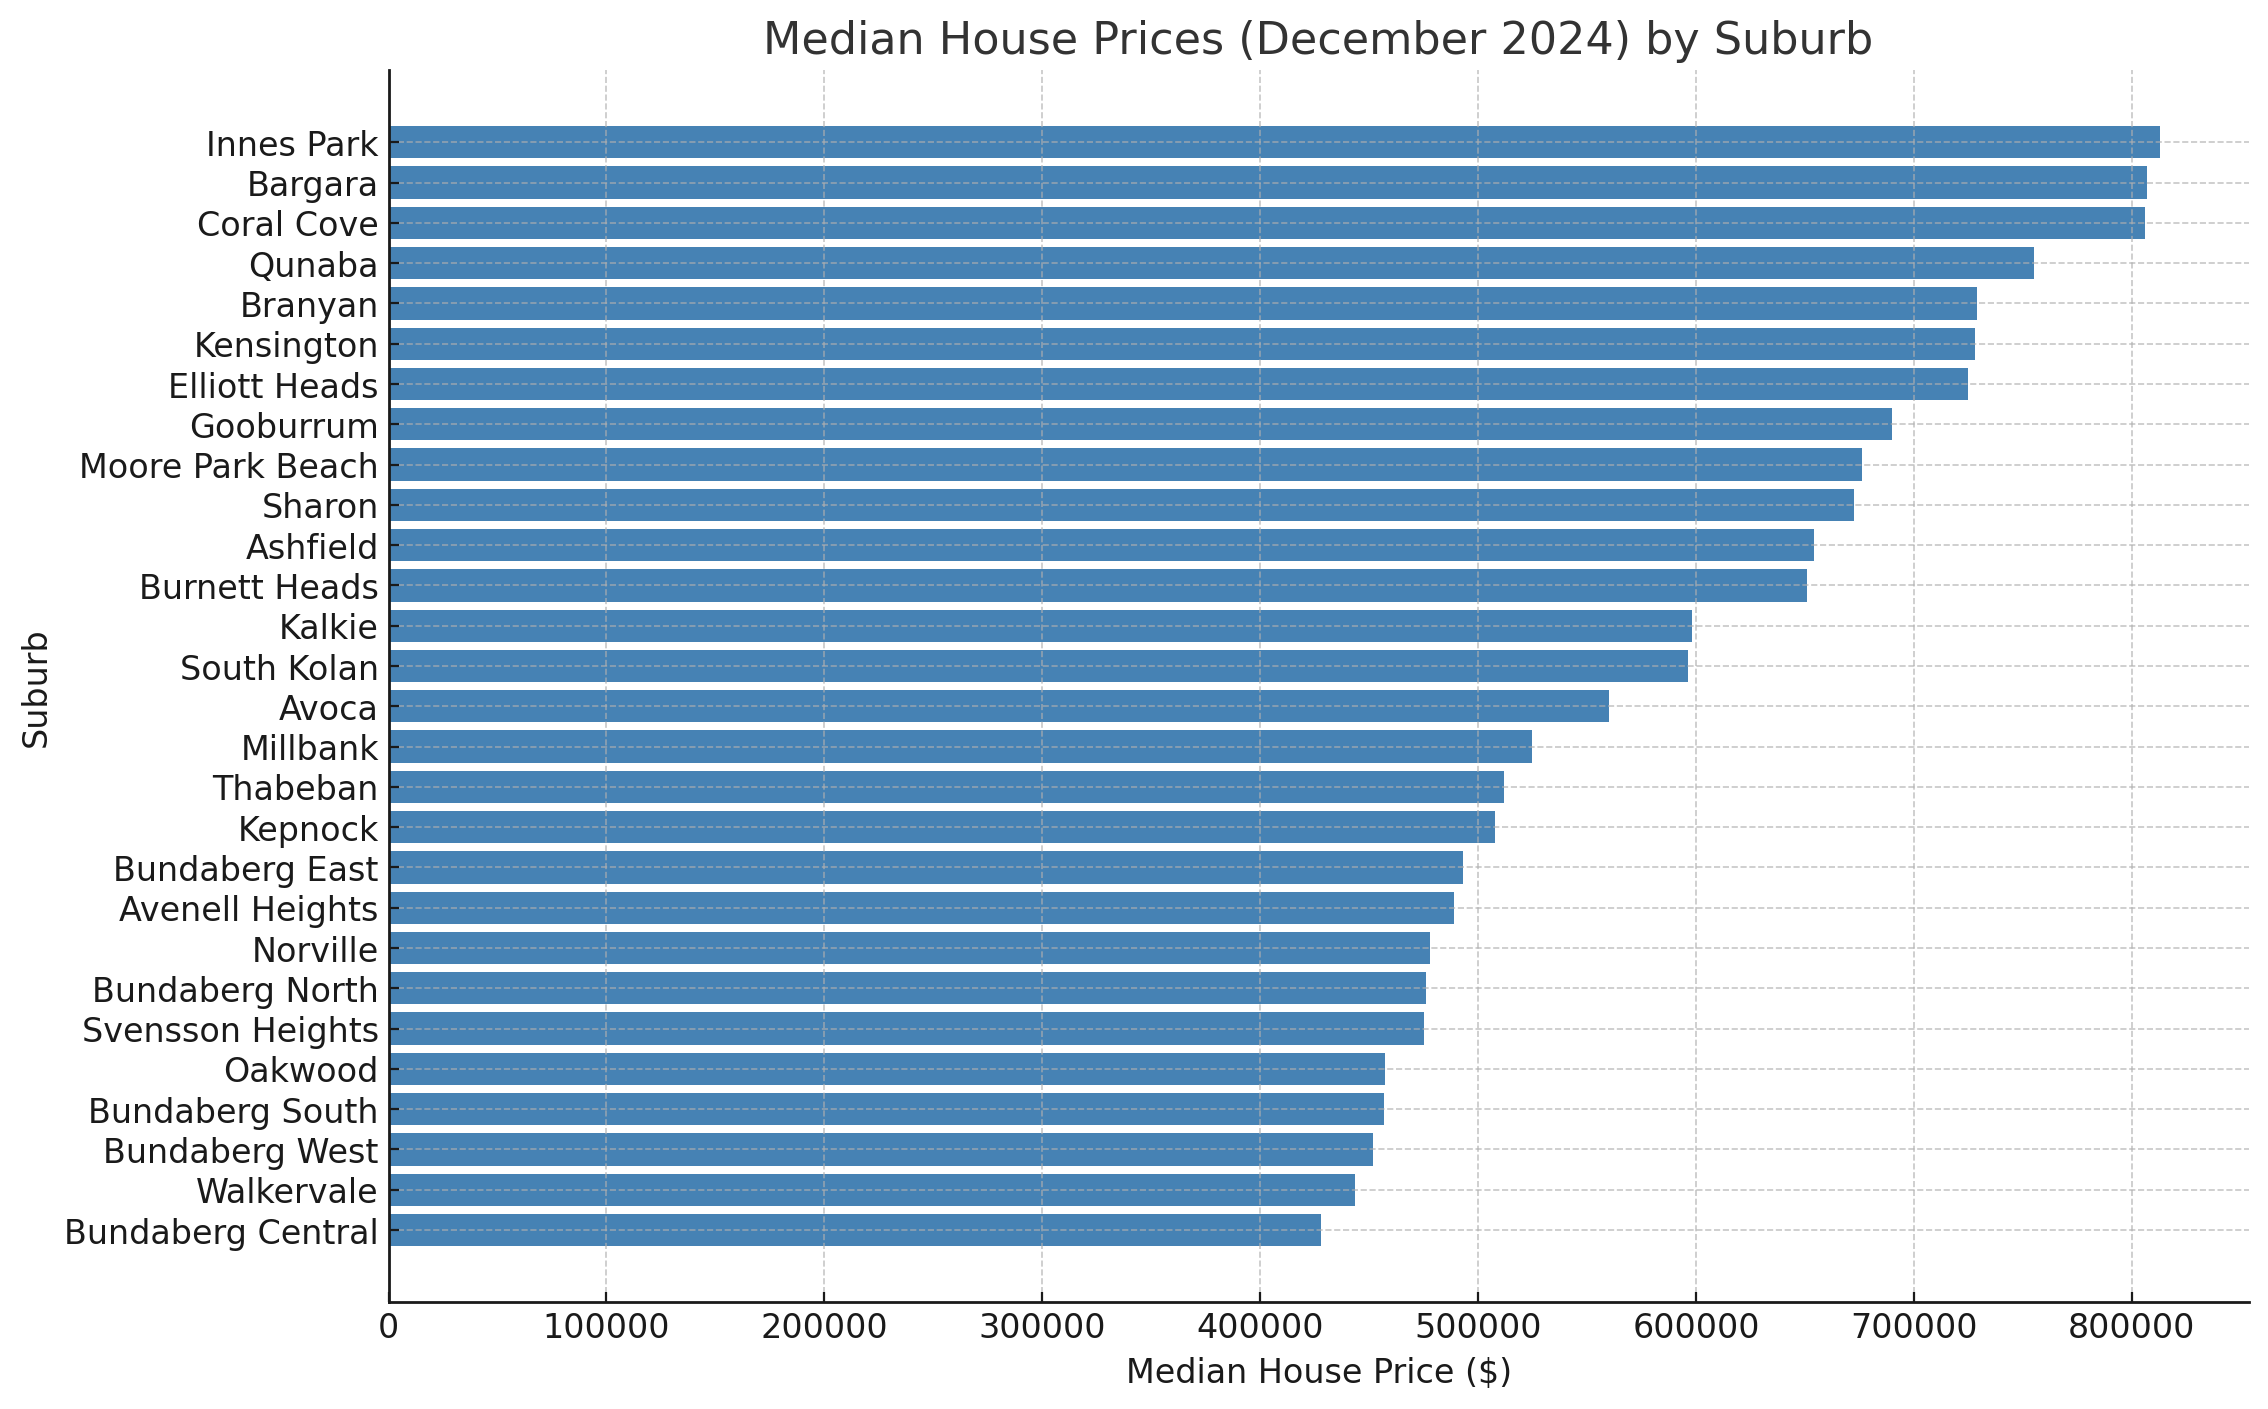
Median House Prices (December 2024)
The current median house prices for each suburb:
| Suburb | Median House Price ($) |
|---|---|
| Ashfield | $654,379 |
| Avenell Heights | $489,000 |
| Avoca | $560,000 |
| Bargara | $807,000 |
| Branyan | $729,000 |
| Bundaberg Central | $428,000 |
| Bundaberg East | $493,000 |
| Bundaberg North | $476,000 |
| Bundaberg South | $457,000 |
| Bundaberg West | $452,000 |
| Burnett Heads | $651,000 |
| Coral Cove | $806,000 |
| Elliott Heads | $725,000 |
| Gooburrum | $689,819 |
| Innes Park | $813,000 |
| Kalkie | $598,000 |
| Kensington | $728,000 |
| Kepnock | $508,000 |
| Millbank | $525,000 |
| Moore Park Beach | $676,000 |
| Norville | $478,000 |
| Oakwood | $457,500 |
| Qunaba | $755,000 |
| Sharon | $672,500 |
| South Kolan | $596,596 |
| Svensson Heights | $475,000 |
| Thabeban | $512,000 |
| Walkervale | $443,500 |
 (Click/tap in enlarge)
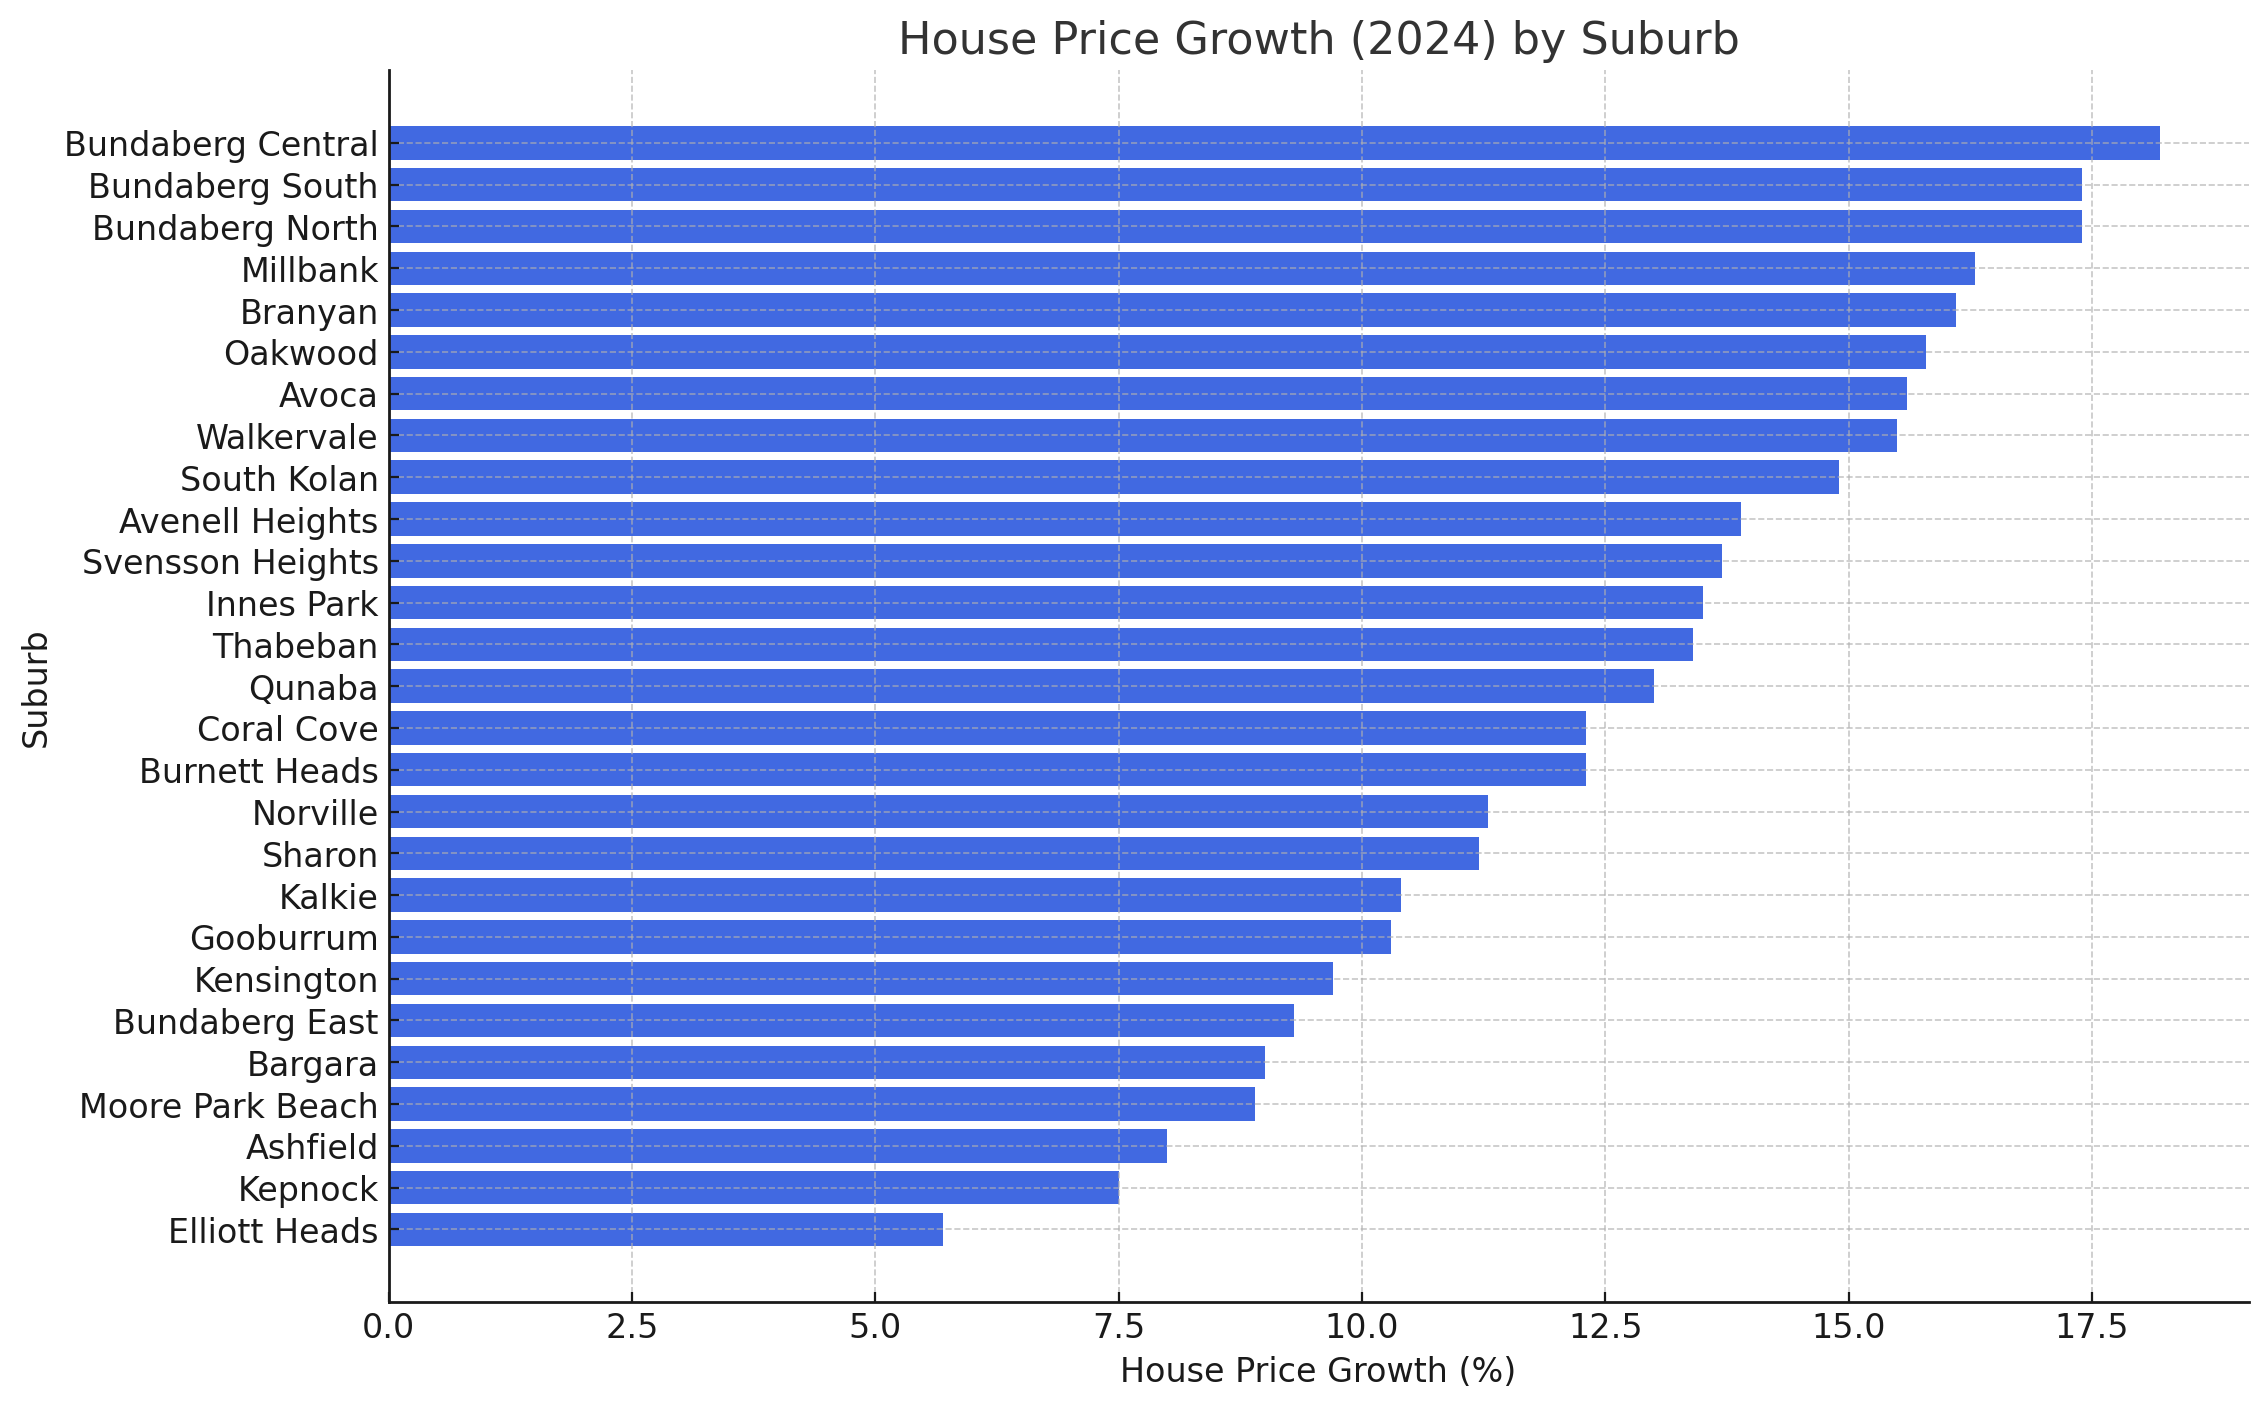
House Price Growth (2024)
The percentage change in median house values from December 2023 to December 2024 for each suburb:
| Suburb | House Price Growth (%) |
|---|---|
| Ashfield | 8.0% |
| Avenell Heights | 13.9% |
| Avoca | 15.6% |
| Bargara | 9.0% |
| Branyan | 16.1% |
| Bundaberg Central | 18.2% |
| Bundaberg East | 9.3% |
| Bundaberg North | 17.4% |
| Bundaberg South | 17.4% |
| Burnett Heads | 12.3% |
| Coral Cove | 12.3% |
| Elliott Heads | 5.7% |
| Gooburrum | 10.3% |
| Innes Park | 13.5% |
| Kalkie | 10.4% |
| Kensington | 9.7% |
| Kepnock | 7.5% |
| Millbank | 16.3% |
| Moore Park Beach | 8.9% |
| Norville | 11.3% |
| Oakwood | 15.8% |
| Qunaba | 13.0% |
| Sharon | 11.2% |
| South Kolan | 14.9% |
| Svensson Heights | 13.7% |
| Thabeban | 13.4% |
| Walkervale | 15.5% |
 (Click/tap in enlarge)
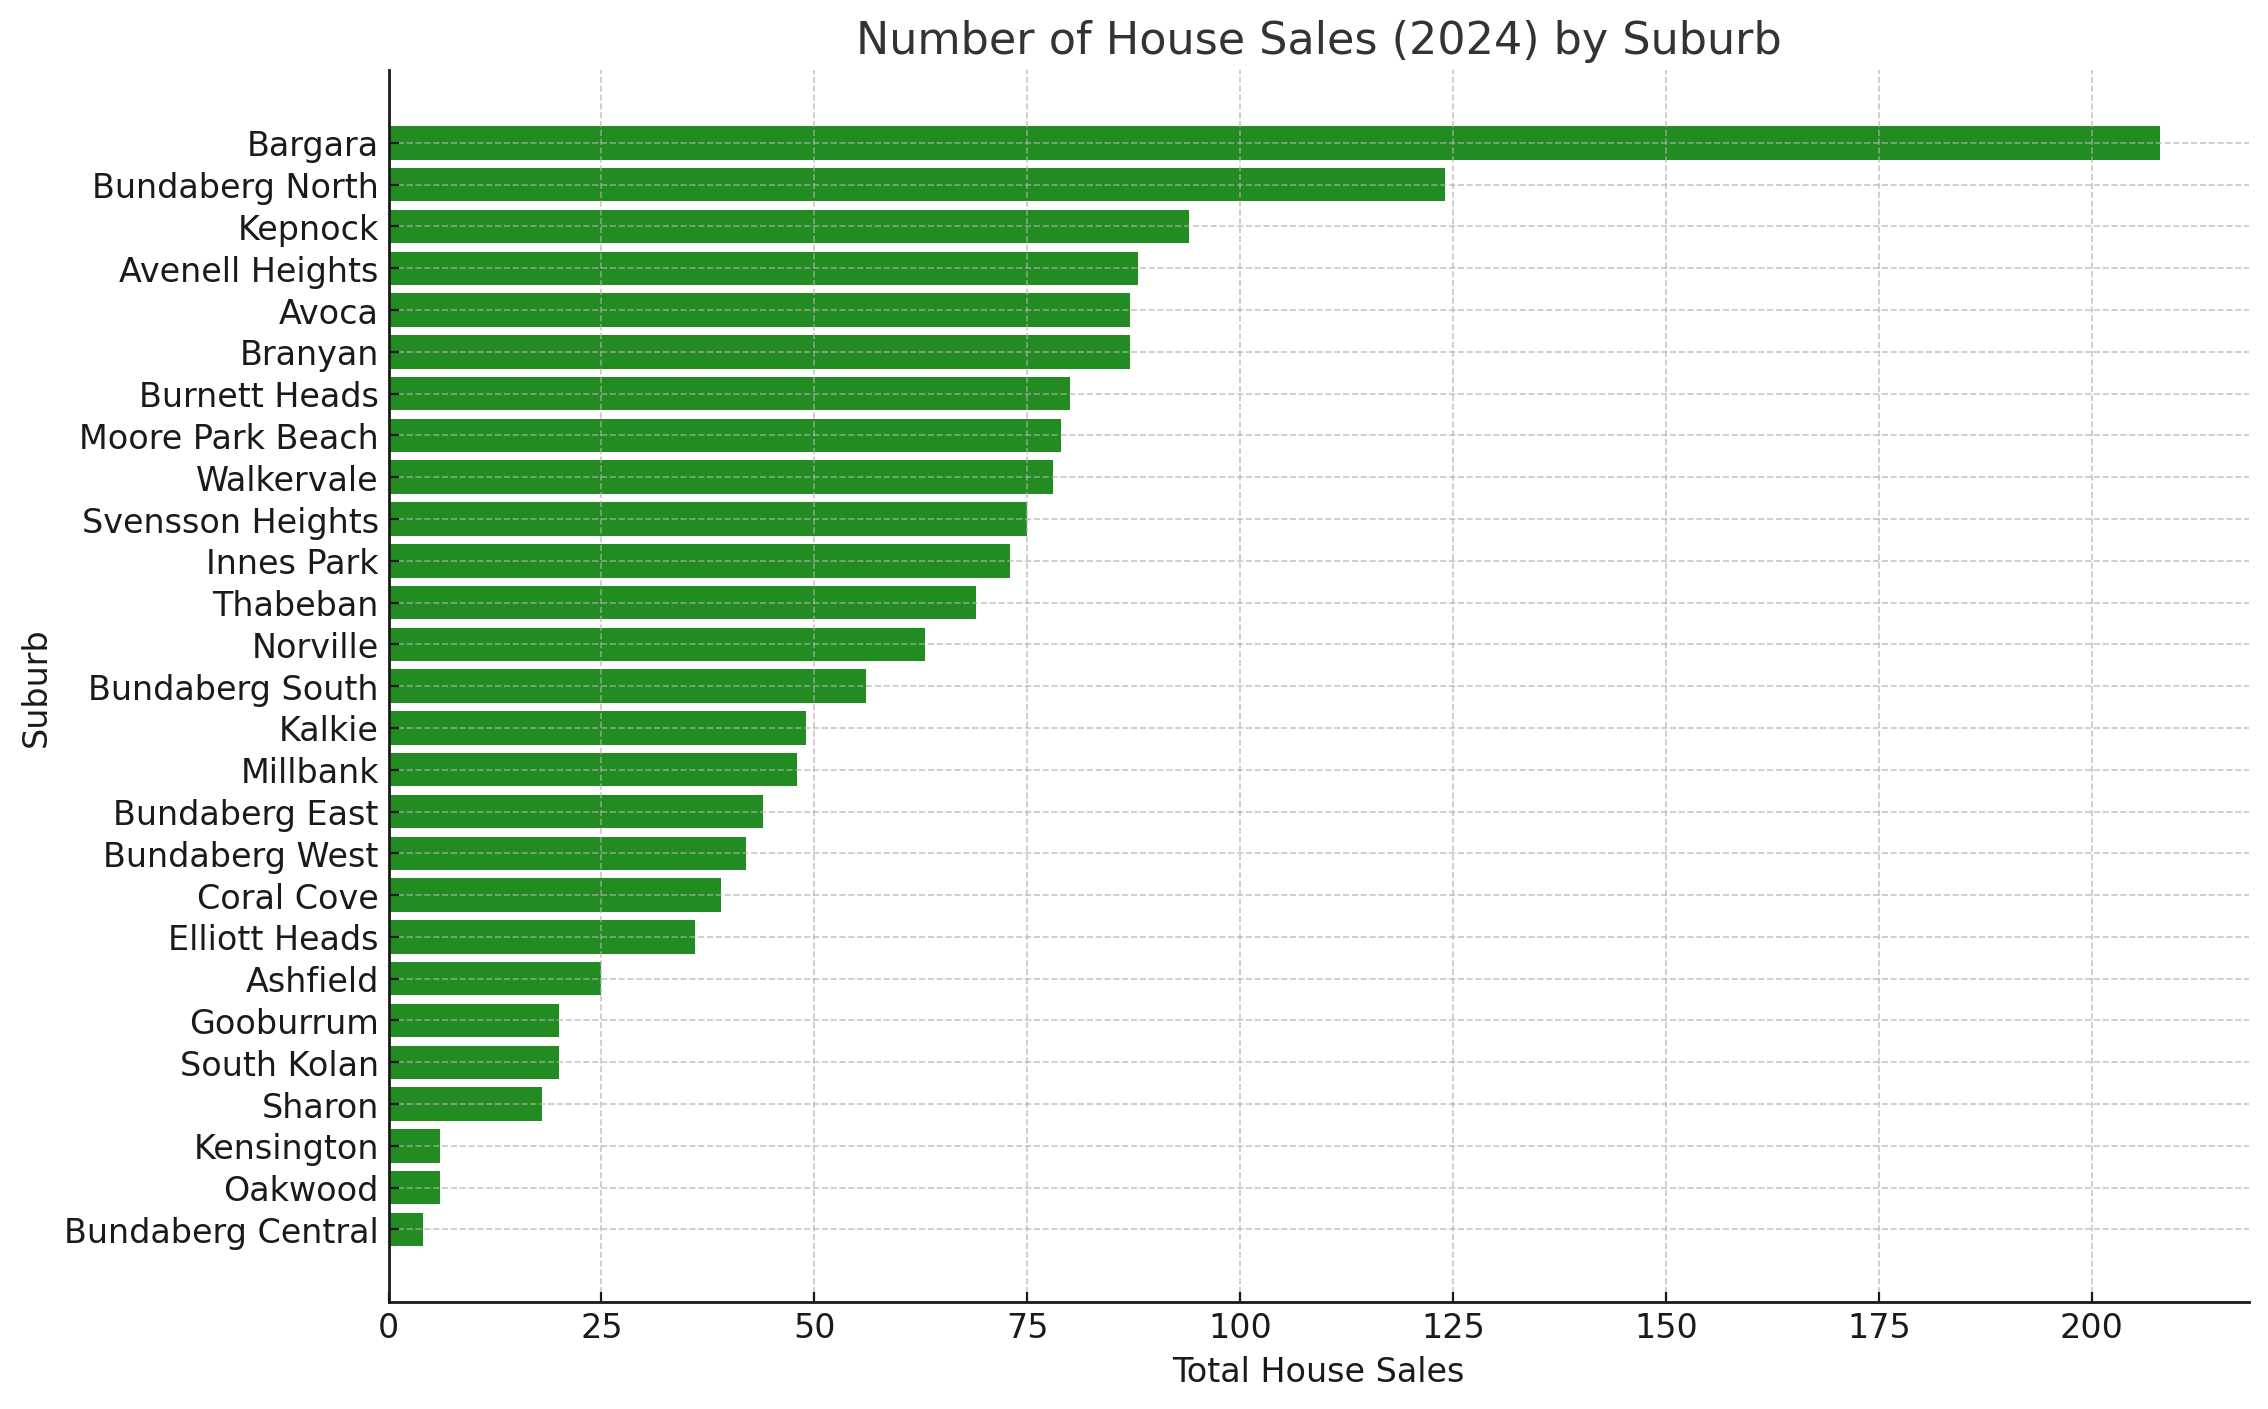
Number of House Sales (2024)
Total number of house sales for each suburb:
| Suburb | Total House Sales |
|---|---|
| Bargara | 208 |
| Bundaberg North | 124 |
| Kepnock | 94 |
| Avenell Heights | 88 |
| Avoca | 87 |
| Branyan | 87 |
| Burnett Heads | 80 |
| Moore Park Beach | 79 |
| Walkervale | 78 |
| Svensson Heights | 75 |
| Innes Park | 73 |
| Thabeban | 69 |
| Norville | 63 |
| Bundaberg South | 56 |
| Kalkie | 49 |
| Millbank | 48 |
| Bundaberg East | 44 |
| Bundaberg West | 42 |
| Elliott Heads | 36 |
| Coral Cove | 39 |
| Ashfield | 25 |
| Gooburrum | 20 |
| South Kolan | 20 |
| Sharon | 18 |
| Oakwood | 6 |
| Kensington | 6 |
| Bundaberg Central | 4 |
 (Click/tap in enlarge)
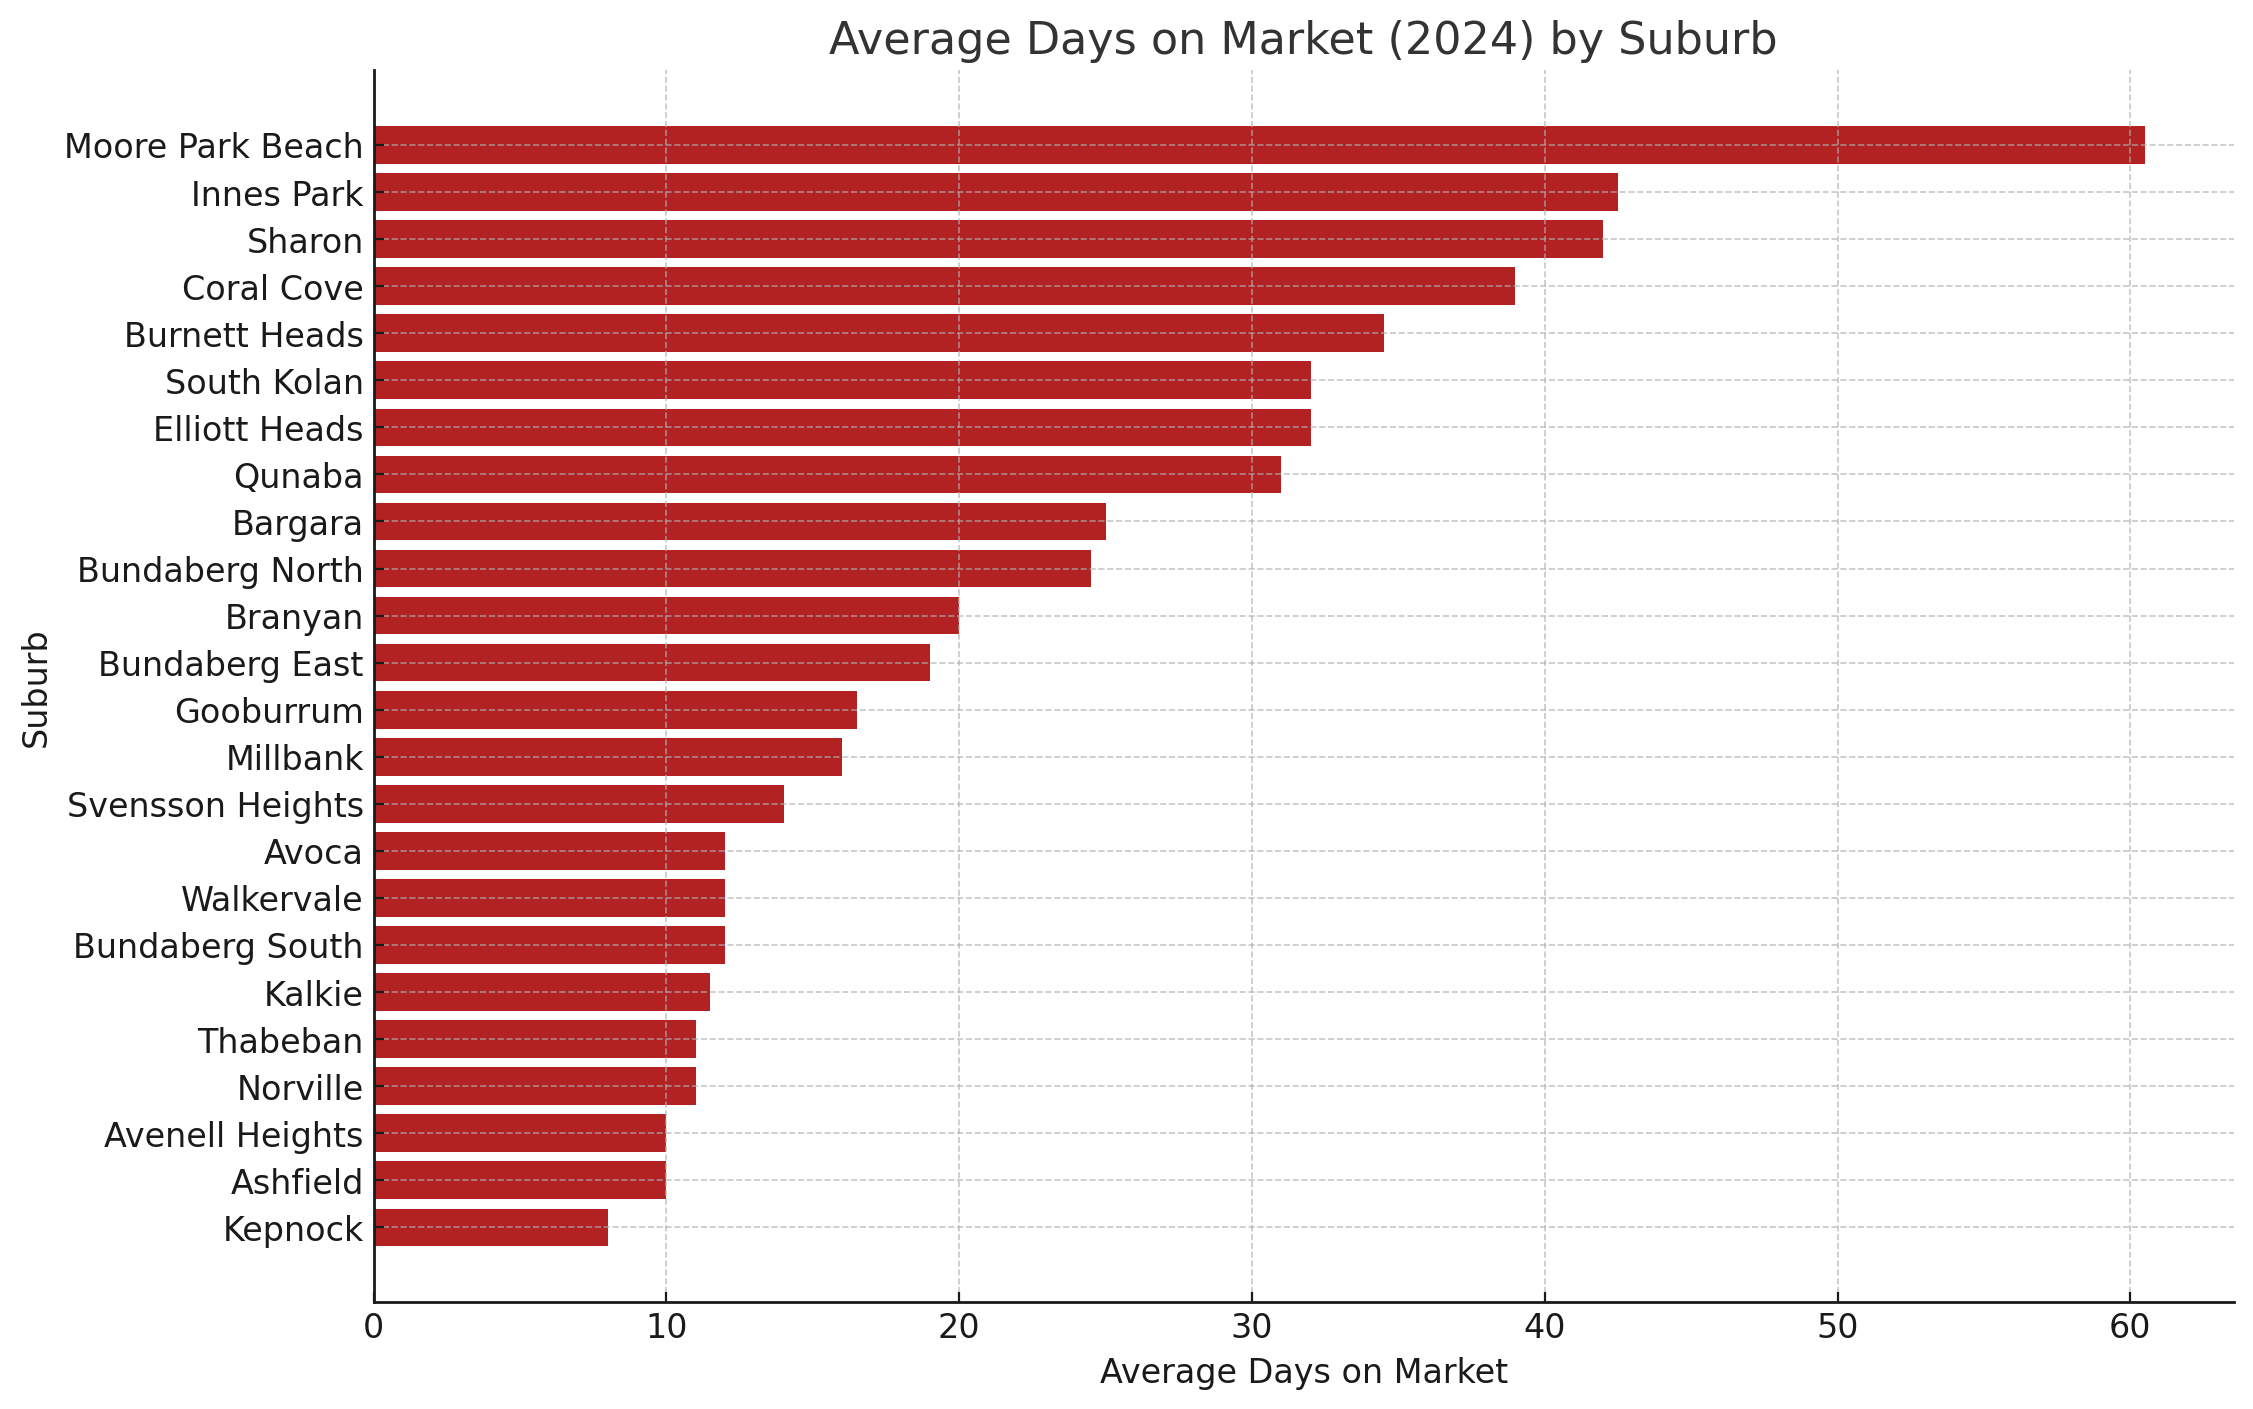
Average Days on Market (2024)
The average time taken for houses to sell:
| Suburb | Days on Market |
|---|---|
| Ashfield | 10 days |
| Avenell Heights | 10 days |
| Avoca | 12 days |
| Bargara | 25 days |
| Branyan | 20 days |
| Bundaberg East | 19 days |
| Bundaberg North | 24.5 days |
| Bundaberg South | 12 days |
| Burnett Heads | 34.5 days |
| Coral Cove | 39 days |
| Elliott Heads | 32 days |
| Gooburrum | 16.5 days |
| Innes Park | 42.5 days |
| Kalkie | 11.5 days |
| Kepnock | 8 days |
| Millbank | 16 days |
| Moore Park Beach | 60.5 days |
| Norville | 11 days |
| Qunaba | 31 days |
| Sharon | 42 days |
| South Kolan | 32 days |
| Svensson Heights | 14 days |
| Thabeban | 11 days |
| Walkervale | 12 days |
 (Click/tap in enlarge)
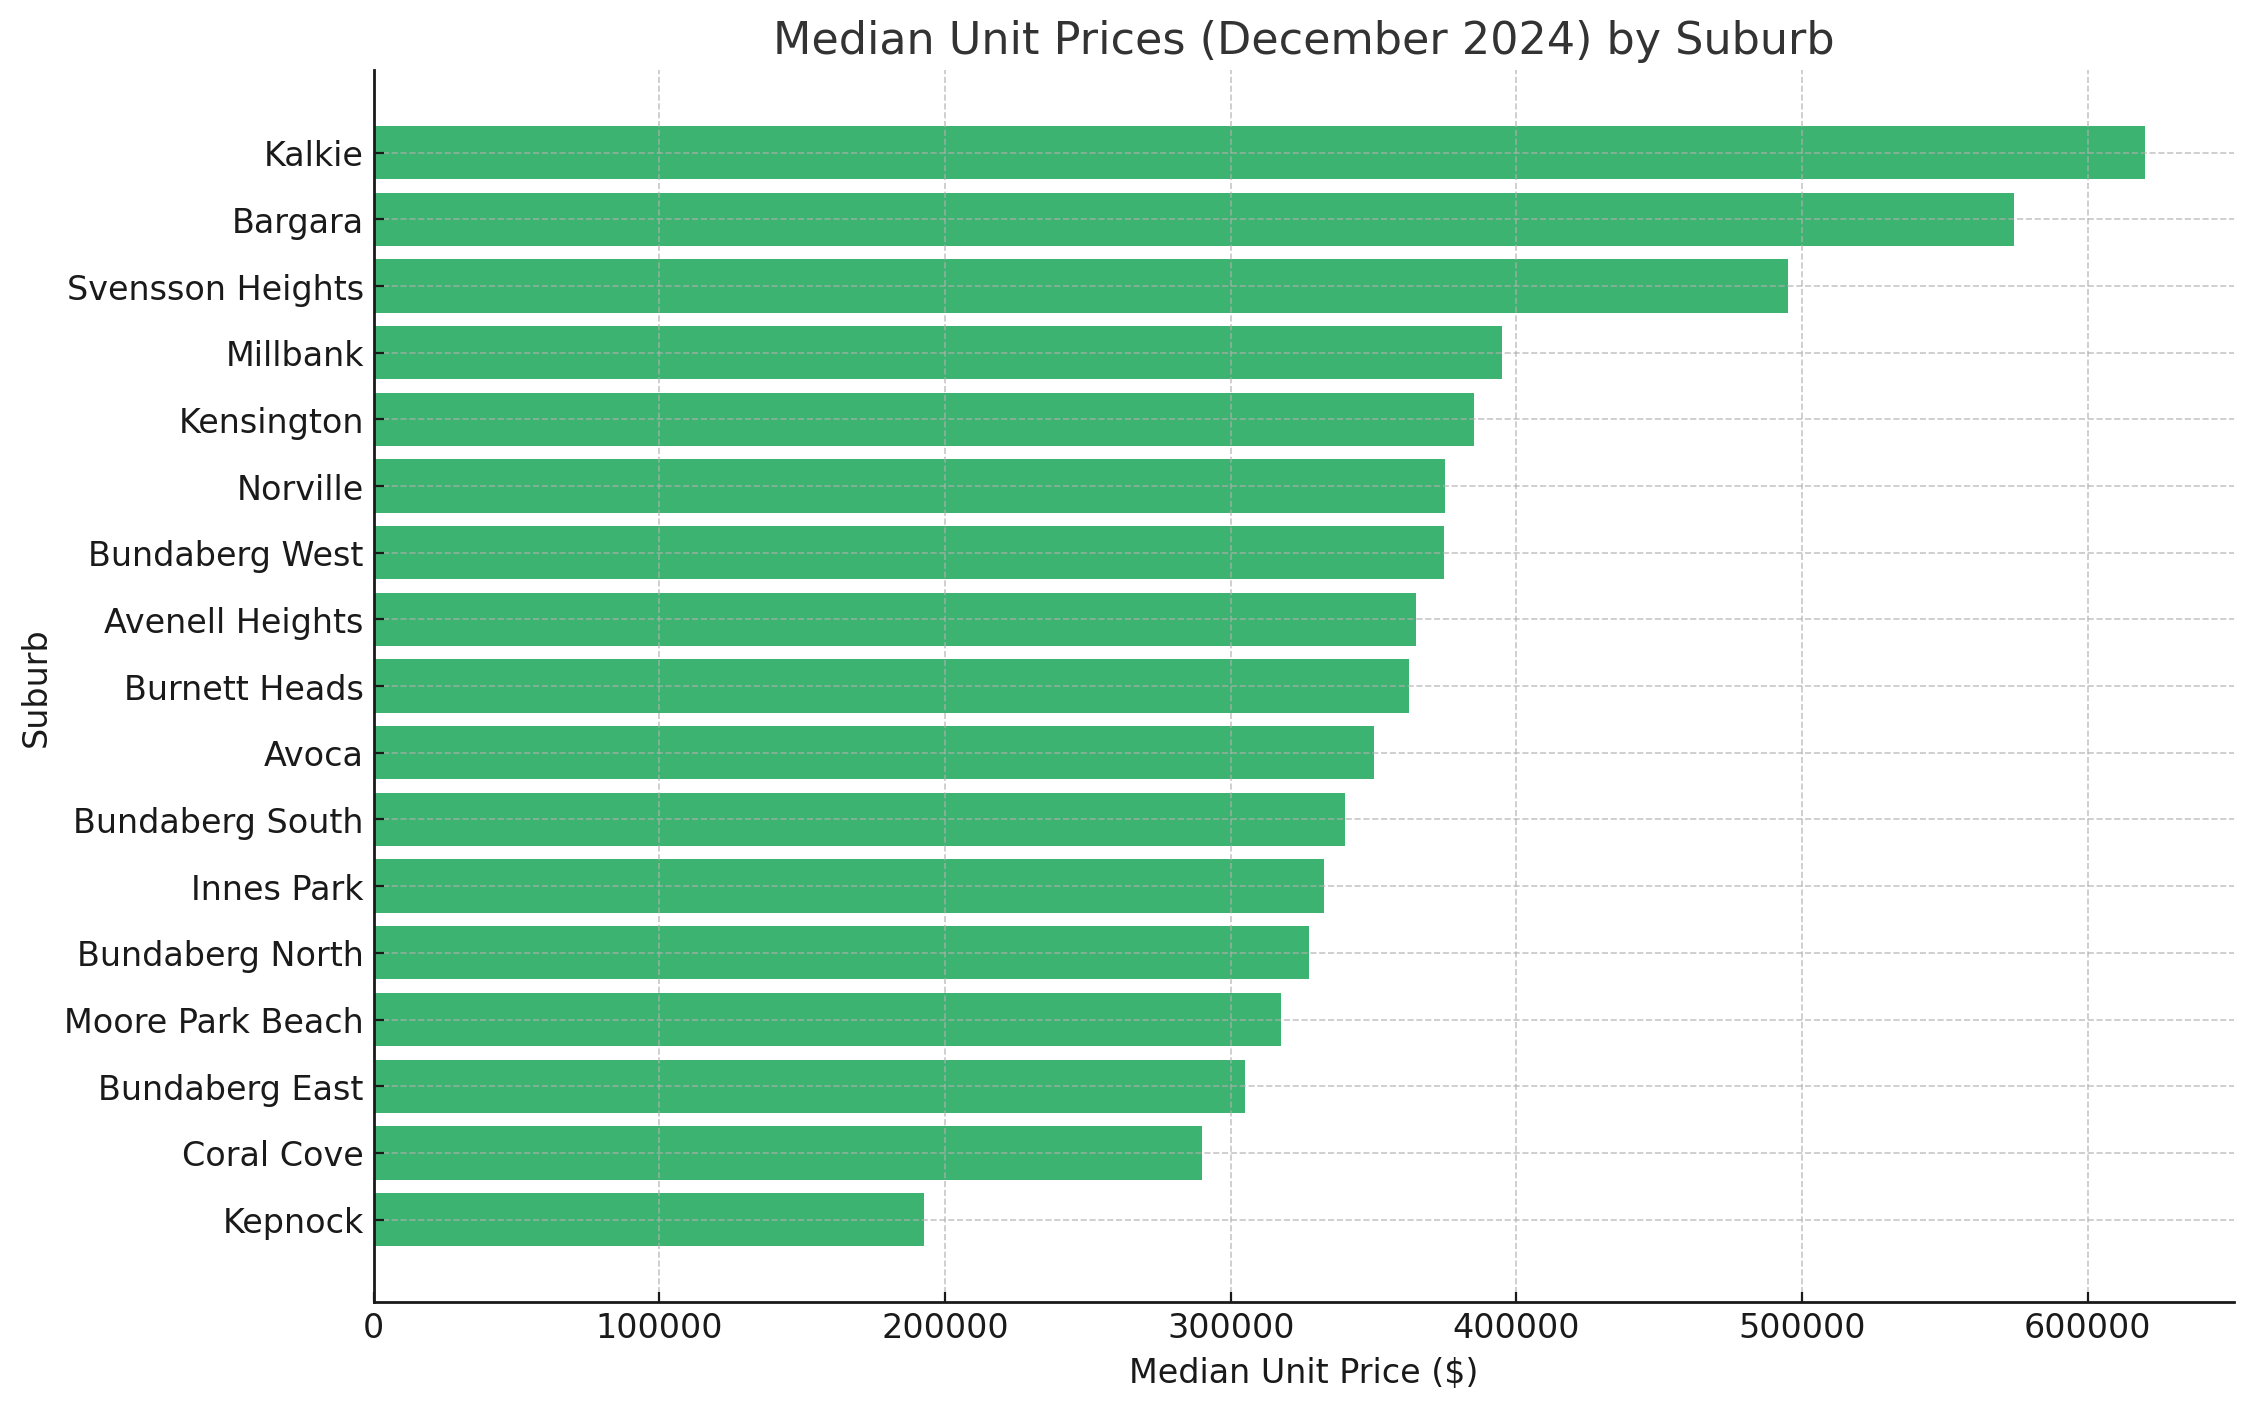
Median Unit Prices (December 2024)
The current median unit prices for each suburb:
| Suburb | Median Unit Price ($) |
|---|---|
| Avenell Heights | $365,000 |
| Avoca | $350,000 |
| Bargara | $574,000 |
| Bundaberg East | $305,000 |
| Bundaberg North | $327,500 |
| Bundaberg South | $340,000 |
| Bundaberg West | $374,500 |
| Burnett Heads | $362,500 |
| Coral Cove | $290,000 |
| Innes Park | $332,500 |
| Kalkie | $620,000 |
| Kensington | $385,000 |
| Kepnock | $192,500 |
| Millbank | $395,000 |
| Moore Park Beach | $317,500 |
| Norville | $375,000 |
| Svensson Heights | $495,000 |
 (Click/tap in enlarge)
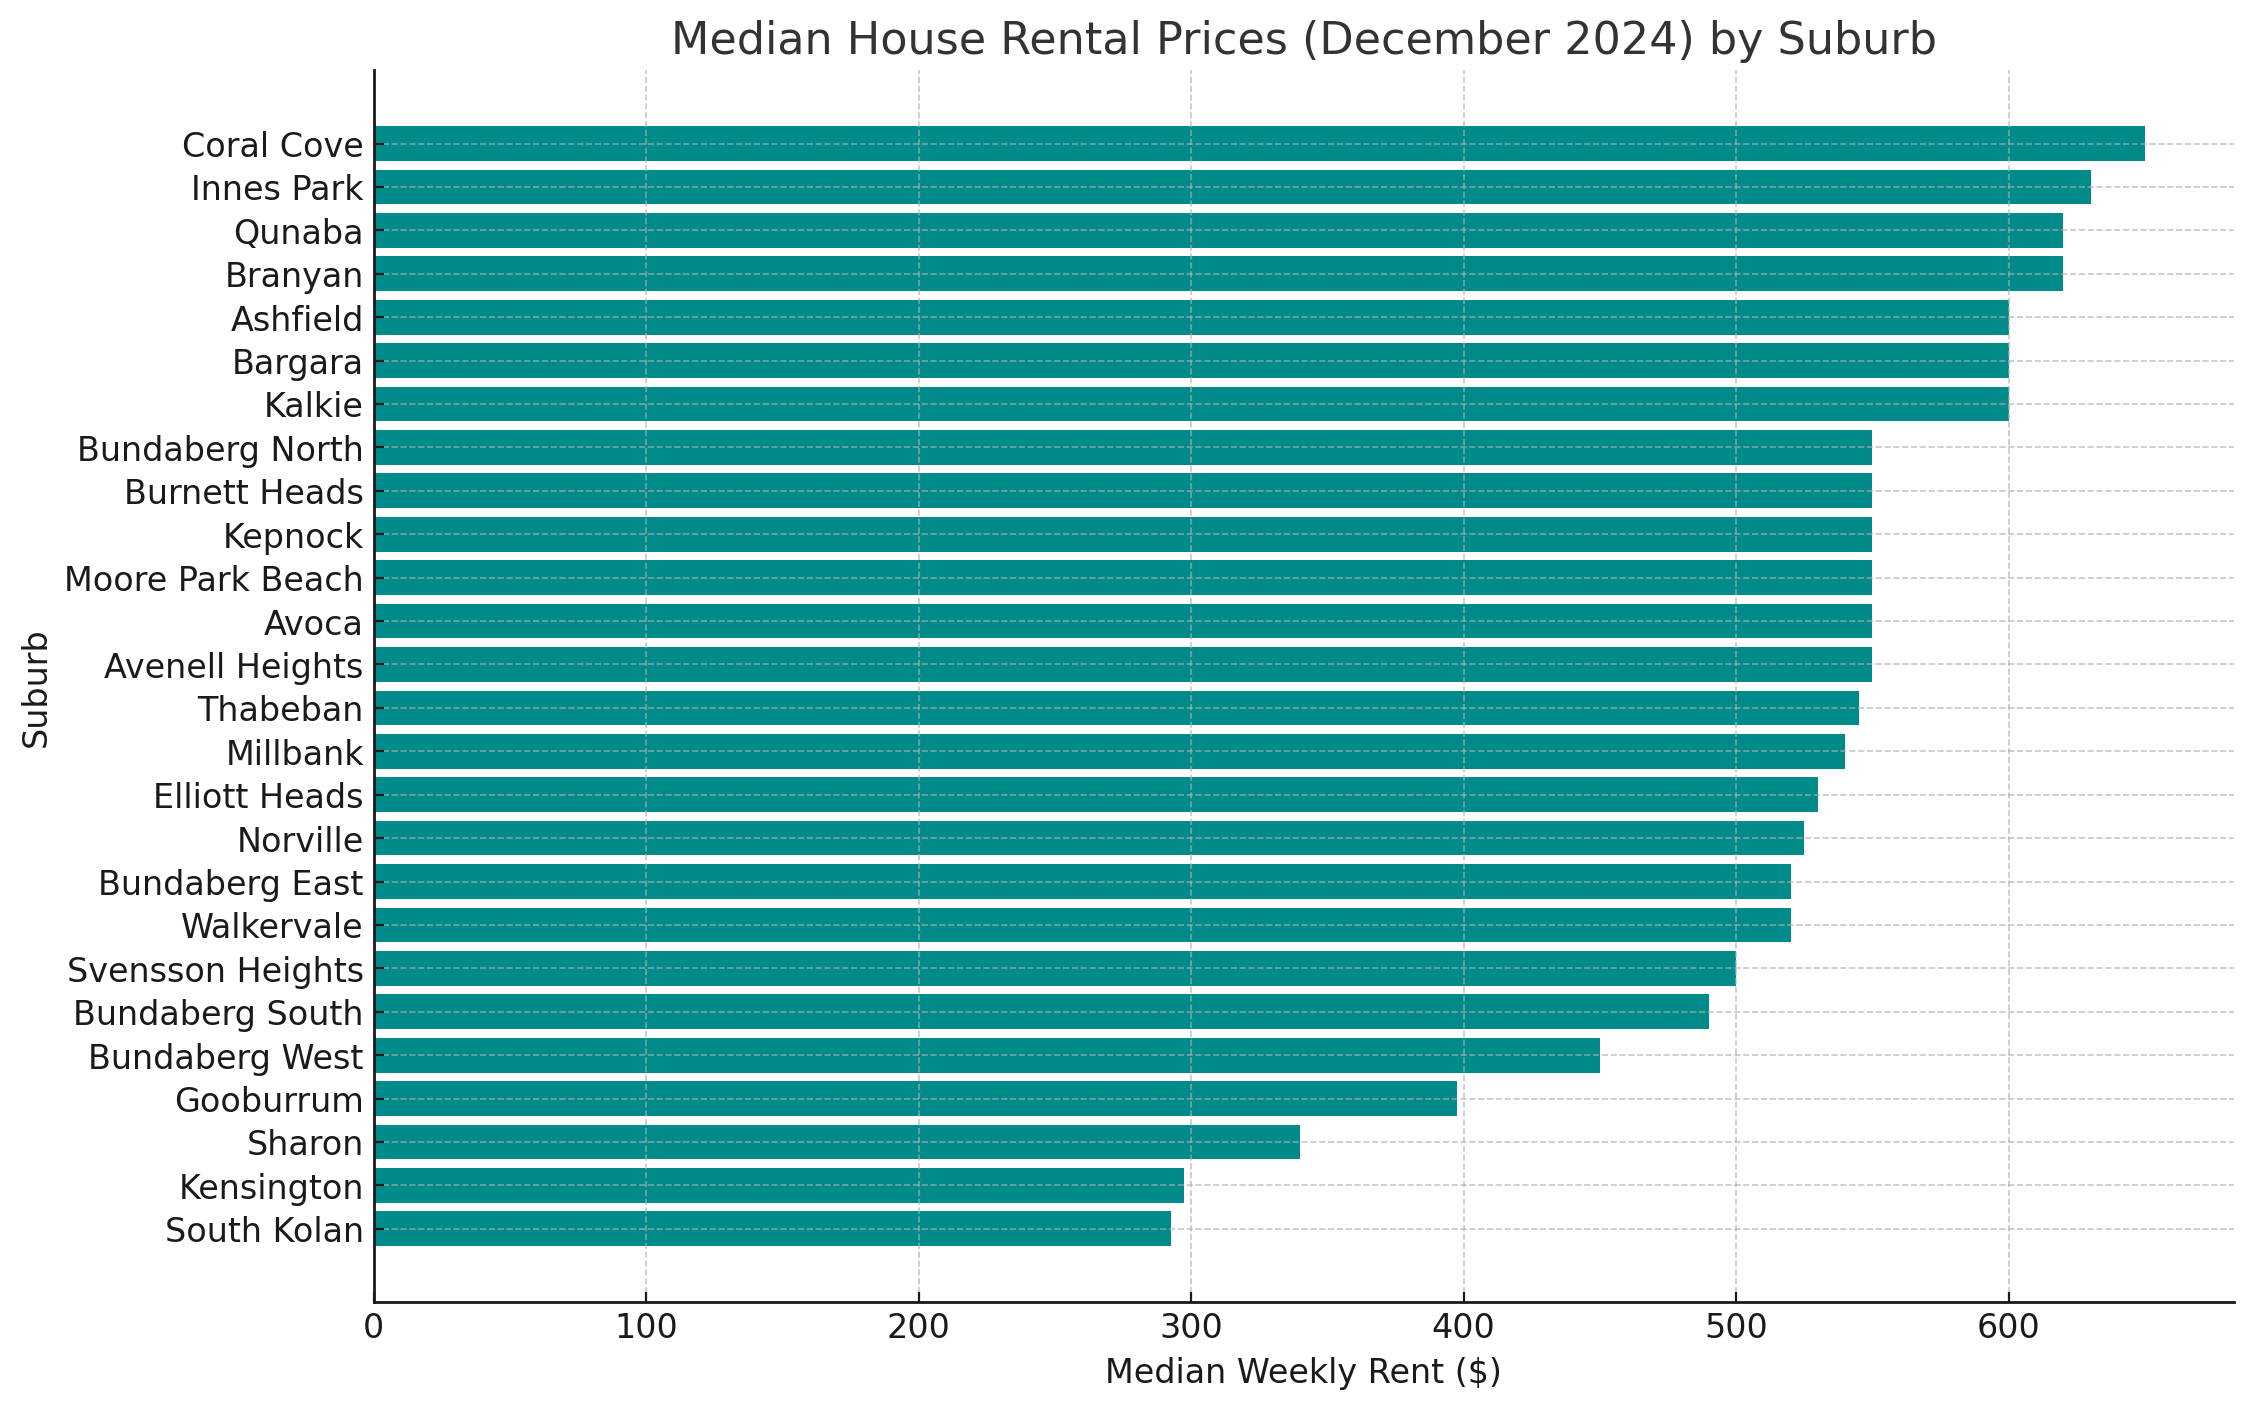
Median House Rental Prices (December 2024)
The current median weekly rent for houses in each suburb:
| Suburb | Median Rent ($/w) |
|---|---|
| Ashfield | $600/w |
| Avenell Heights | $550/w |
| Avoca | $550/w |
| Bargara | $600/w |
| Branyan | $620/w |
| Bundaberg East | $520/w |
| Bundaberg North | $550/w |
| Bundaberg South | $490/w |
| Bundaberg West | $450/w |
| Burnett Heads | $550/w |
| Coral Cove | $650/w |
| Elliott Heads | $530/w |
| Gooburrum | $397.5/w |
| Innes Park | $630/w |
| Kalkie | $600/w |
| Kensington | $297.5/w |
| Kepnock | $550/w |
| Millbank | $540/w |
| Moore Park Beach | $550/w |
| Norville | $525/w |
| Qunaba | $620/w |
| Sharon | $340/w |
| South Kolan | $292.5/w |
| Svensson Heights | $500/w |
| Thabeban | $545/w |
| Walkervale | $520/w |
 (Click/tap in enlarge)
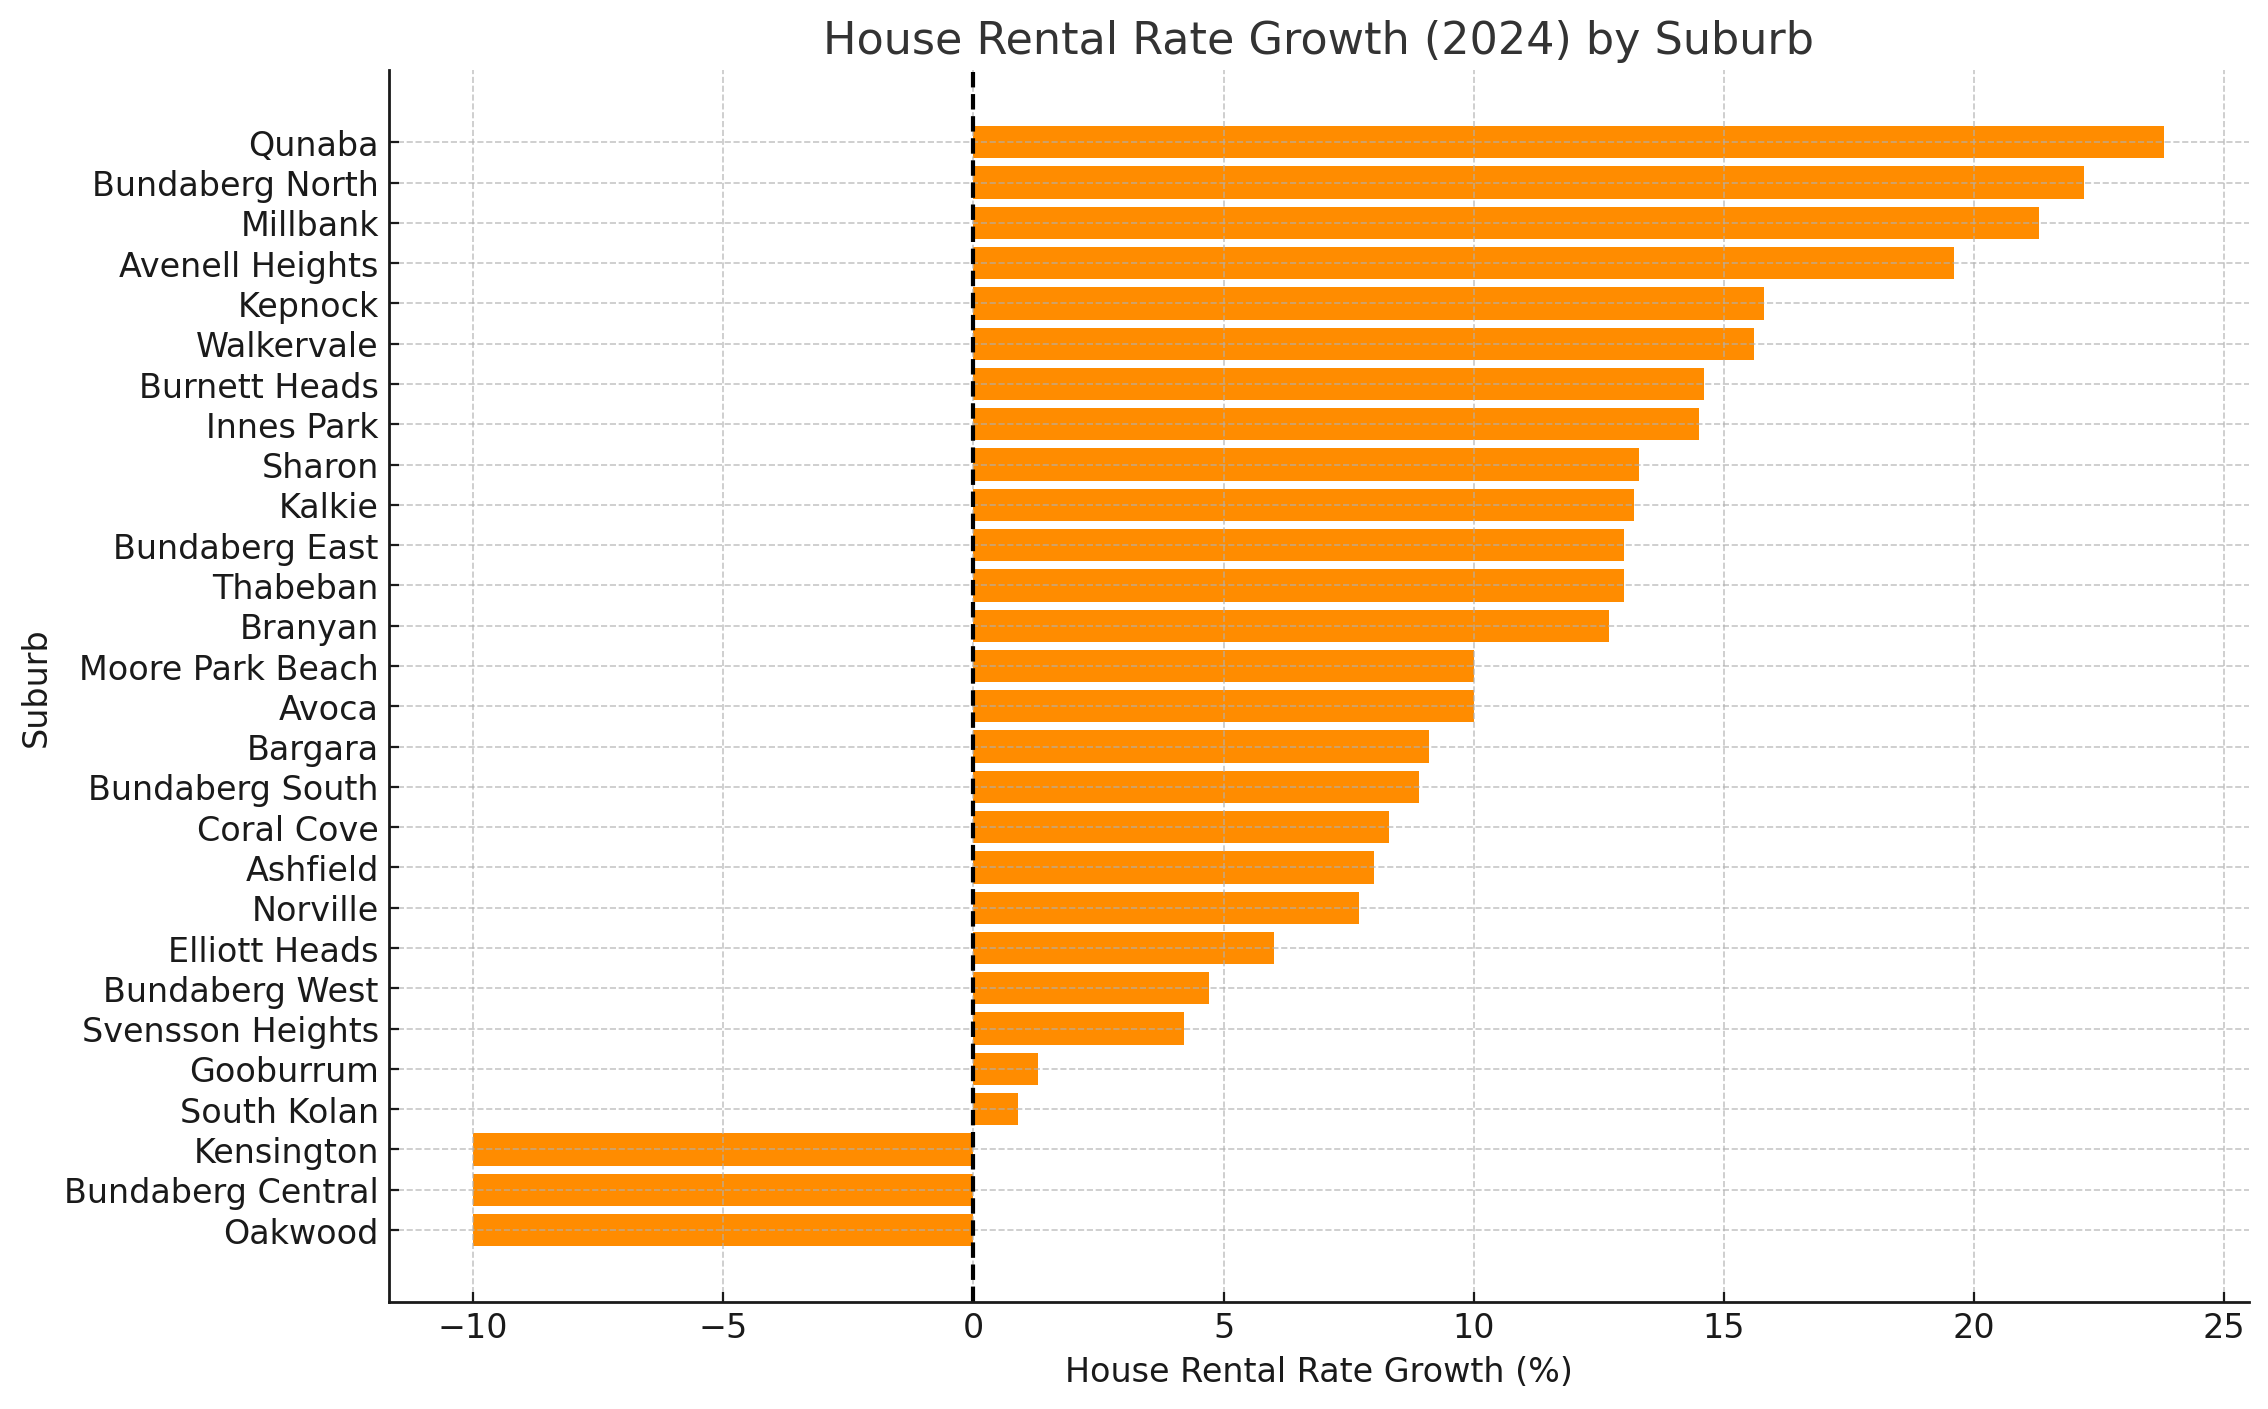
House Rental Rate Growth (2024)
The percentage change in rental rates for houses in each suburb:
| Suburb | House Rental Rate Growth (%) |
|---|---|
| Ashfield | 8.0% |
| Avenell Heights | 19.6% |
| Avoca | 10.0% |
| Bargara | 9.1% |
| Branyan | 12.7% |
| Bundaberg Central | -10.0% |
| Bundaberg East | 13.0% |
| Bundaberg North | 22.2% |
| Bundaberg South | 8.9% |
| Bundaberg West | 4.7% |
| Burnett Heads | 14.6% |
| Coral Cove | 8.3% |
| Elliott Heads | 6.0% |
| Gooburrum | 1.3% |
| Innes Park | 14.5% |
| Kalkie | 13.2% |
| Kensington | -10.0% |
| Kepnock | 15.8% |
| Millbank | 21.3% |
| Moore Park Beach | 10.0% |
| Norville | 7.7% |
| Oakwood | -10.0% |
| Qunaba | 23.8% |
| Sharon | 13.3% |
| South Kolan | 0.9% |
| Svensson Heights | 4.2% |
| Thabeban | 13.0% |
| Walkervale | 15.6% |
 (Click/tap in enlarge)
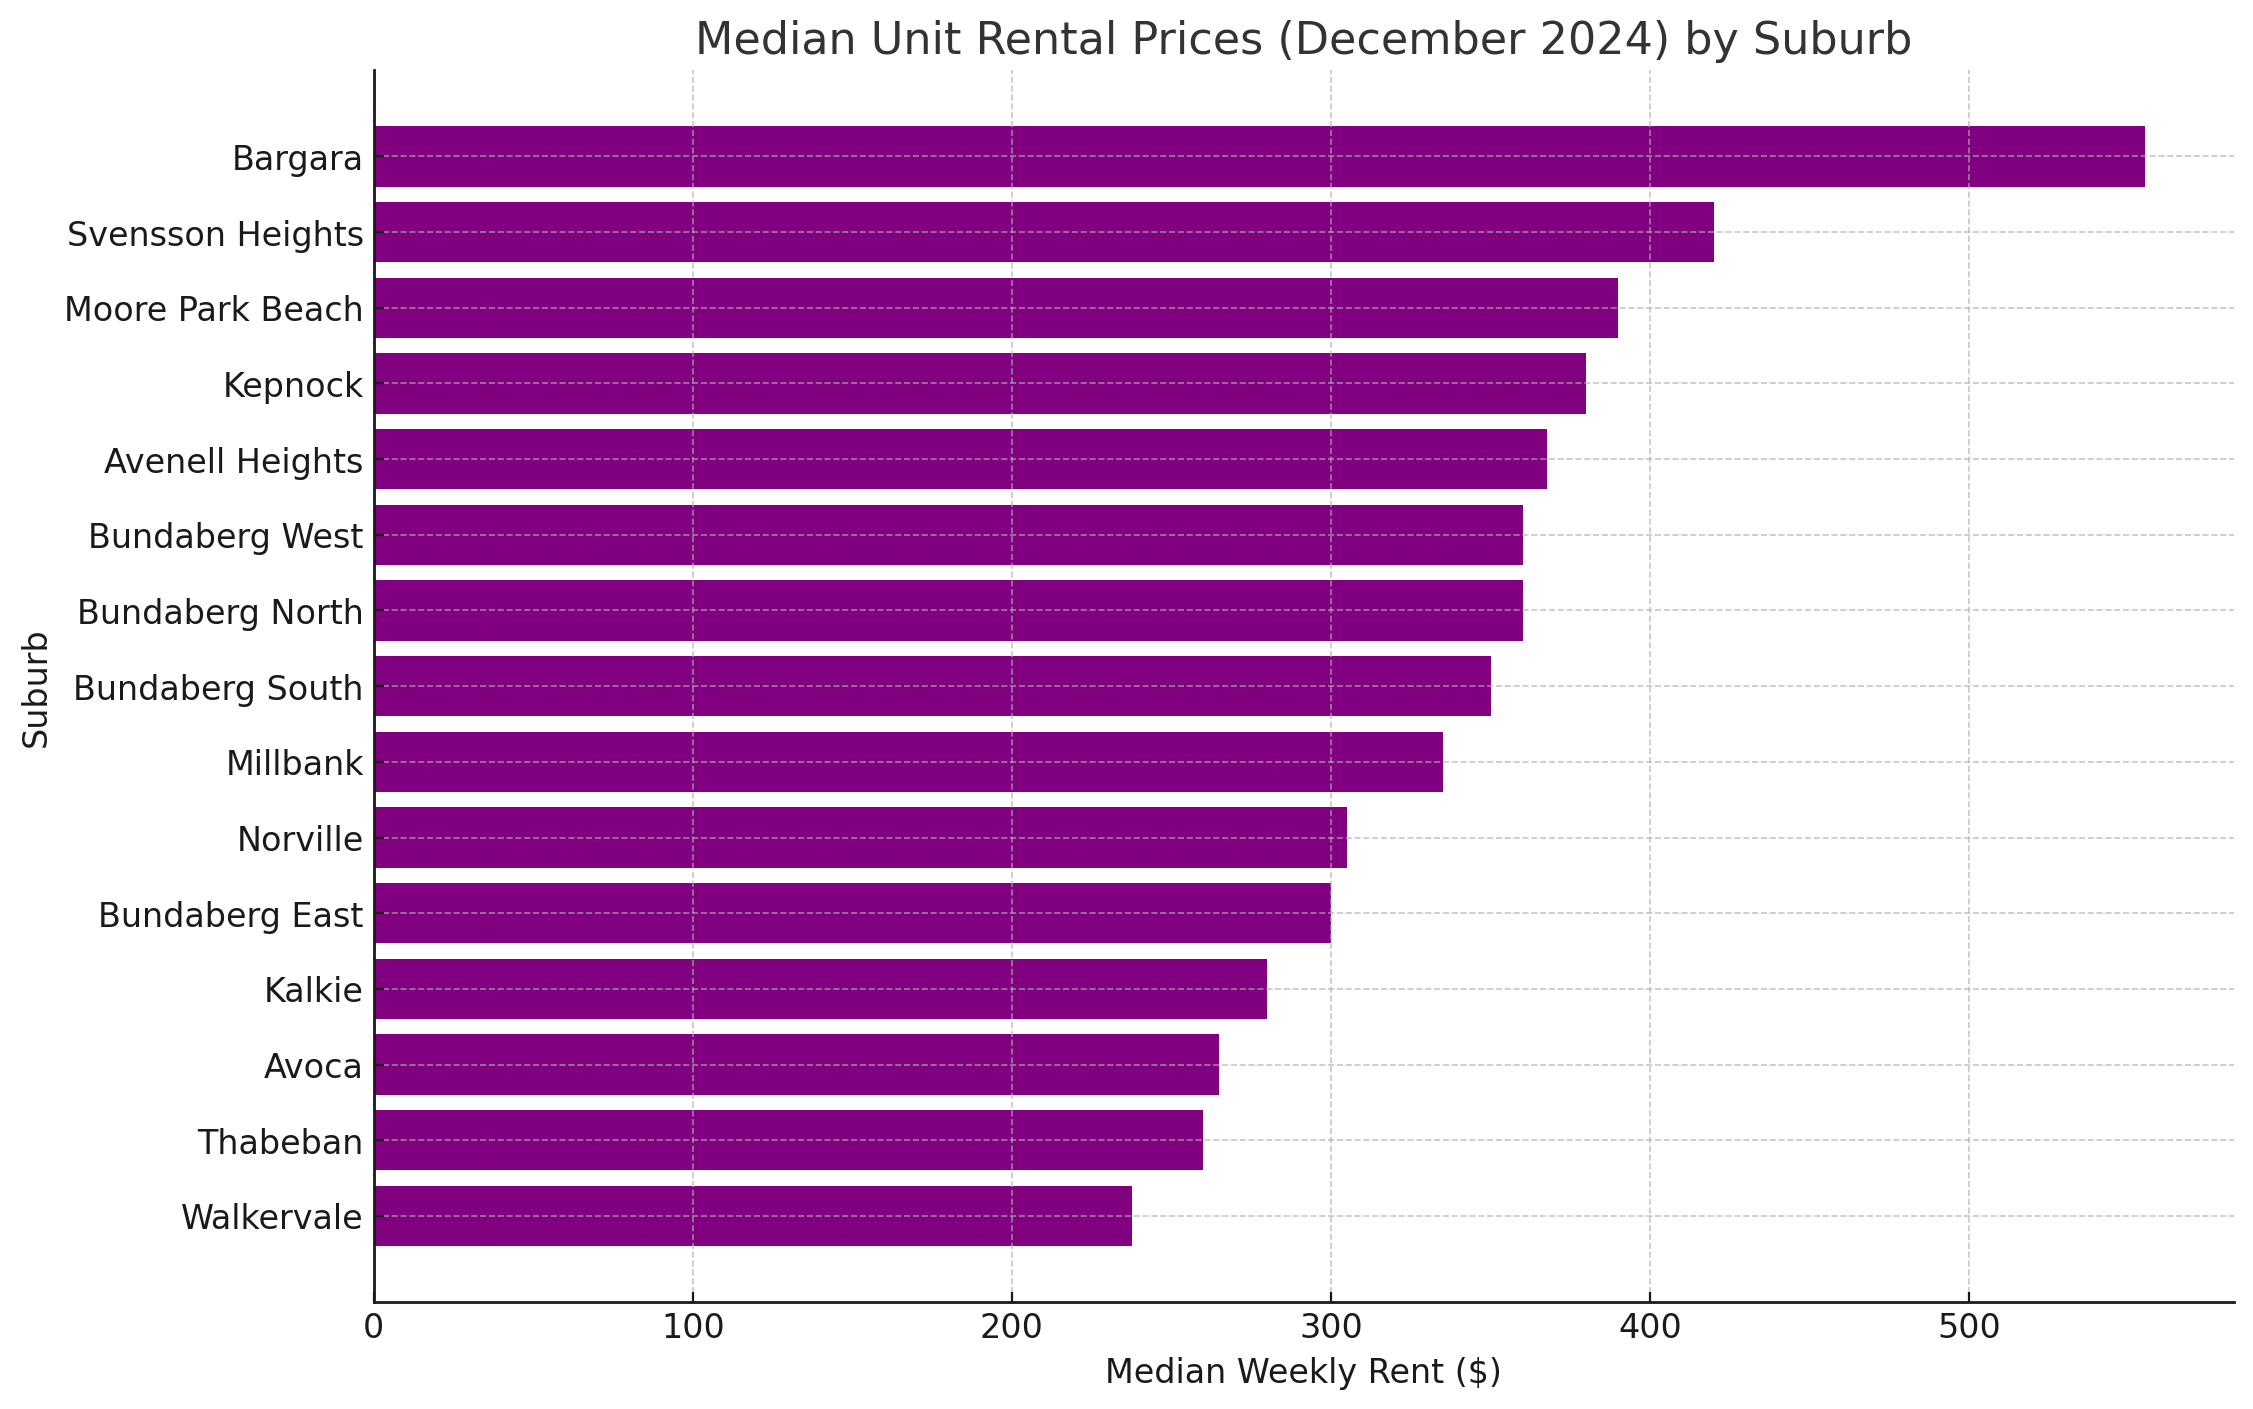
Median Unit Rental Prices (December 2024)
The current median weekly rent for units in each suburb:
| Suburb | Median Rent ($/w) |
|---|---|
| Avenell Heights | $367.5/w |
| Avoca | $265/w |
| Bargara | $555/w |
| Bundaberg East | $300/w |
| Bundaberg North | $360/w |
| Bundaberg South | $350/w |
| Bundaberg West | $360/w |
| Kalkie | $280/w |
| Kepnock | $380/w |
| Millbank | $335/w |
| Moore Park Beach | $390/w |
| Norville | $305/w |
| Svensson Heights | $420/w |
| Thabeban | $260/w |
| Walkervale | $237.5/w |
 (Click/tap in enlarge)
Key Takeaways & Trends
1. House Rental Prices Are Strongest in Coastal and High-Demand Areas
* Coral Cove ($650/w), Innes Park ($630/w), Branyan ($620/w), and Qunaba ($620/w) lead the rental market for houses.
* Coastal suburbs and those with larger properties tend to have higher rental prices, reflecting demand for lifestyle-oriented living.
2. Affordable Housing Still Exists in Certain Suburbs
* The lowest house rental prices were found in South Kolan ($292.5/w), Kensington ($297.5/w), and Sharon ($340/w).
* These areas may appeal to budget-conscious renters or those seeking affordability over proximity to urban centers.
3. Unit Rental Prices Show More Affordability Compared to Houses
* Walkervale ($237.5/w) and Thabeban ($260/w) are the most affordable suburbs for unit rentals.
* The highest unit rental price is in Bargara ($555/w), reinforcing the trend that coastal properties command higher rental demand.
4. High Demand for Rentals in Established Suburbs
* Svensson Heights ($420/w) and Moore Park Beach ($390/w) indicate strong rental demand despite not being the most expensive housing locations.
* Kepnock ($380/w) also maintains steady rental growth, suggesting it is an in-demand suburb.
5. Gap Between House & Unit Rental Prices
* Houses are significantly more expensive to rent than units, with the highest house rents reaching $650/w, while the highest unit rents max out at $555/w.
* Most unit rentals are under $400/w, showing they are a more accessible option for renters.
6. Variability in Rental Prices Across Suburbs
* Some inland suburbs, such as Gooburrum ($397.5/w) for houses and Norville ($305/w) for units, remain mid-range rental options.
* Suburbs with lower property values tend to have lower rental prices, but there are some outliers where demand keeps rents relatively high.
Overall Market Trends
* Coastal areas continue to lead rental pricing, particularly for houses.
* Units remain the more affordable option across all suburbs.
* Affordable rental markets exist in some inland areas, providing options for budget-conscious renters.
* Demand remains strong in both established and lifestyle-focused suburbs.
Bundaberg Property Market Predictions for 2025
House Prices
* Continued growth but at a slower pace than in 2024 due to affordability constraints.
* Regional demand remains strong as more buyers look for affordable alternatives outside major cities.
* Premium suburbs and coastal areas (like Bargara and Innes Park) could see the highest increases due to lifestyle appeal.
* Prediction: 5-8% increase in house prices, with higher growth in sought-after areas.
Unit Prices
* Steady demand as first-home buyers and downsizers look for affordable options.
* Limited supply could push prices up, especially in inner-city Bundaberg and near hospitals/universities.
* Prediction: 4-6% increase in unit prices.
Rental Market
* High demand continues due to a housing shortage and rising interest rates making it harder to buy.
* Rent increases expected, especially for houses in central and coastal areas.
* NDIS-approved rentals and dual-living properties will gain popularity among investors.
Prediction:
* Houses: 8-12% rental price increase.
* Units: 5-8% rental price increase.
Sales & Days on Market
Lower sales volume as affordability pressures and rising rates impact buyers.
Well-priced properties in desirable locations will still sell quickly.
More off-market deals and investor activity expected due to limited supply.
Prediction:
* Amount of Sales: 5-10% decrease.
* Days on Market: Increase slightly, especially for overpriced properties.
Key Drivers for 2025
* Interest Rates: Potential rate cuts in late 2025 could boost buyer confidence.
* Population Growth: Ongoing migration to Bundaberg will sustain housing demand.
* Infrastructure Projects: New developments and road upgrades could drive suburb-specific price growth.