

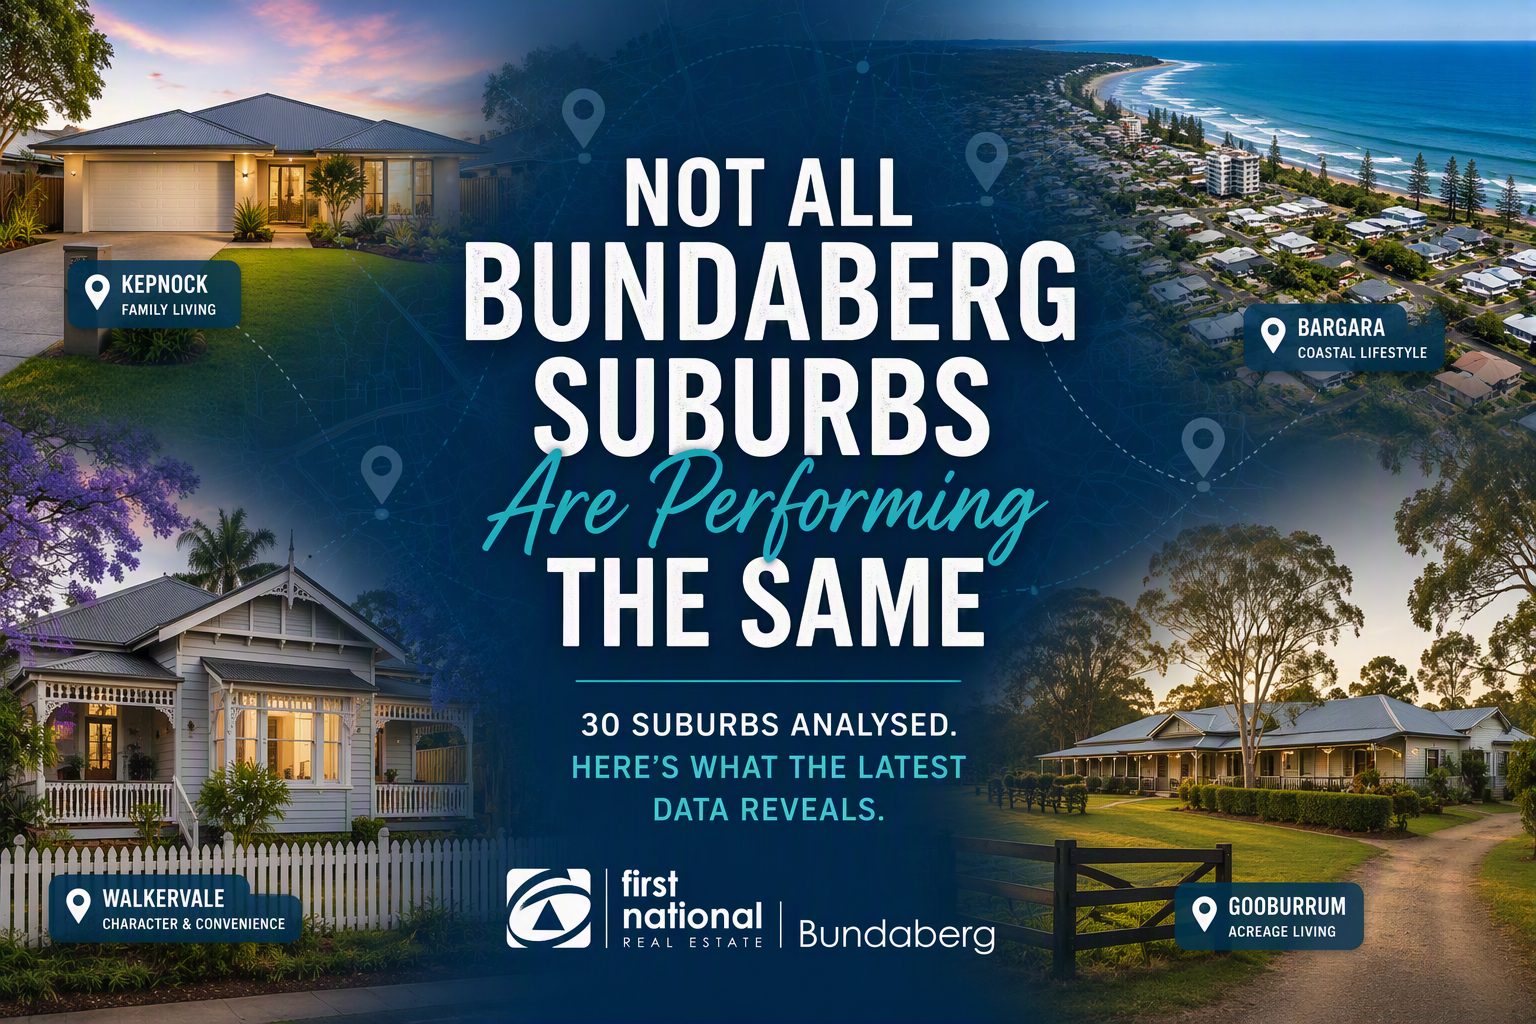
What’s really happening in the Bundaberg property market?
House prices are only one part of the story.
To understand what’s happening across the Bundaberg property market, we analysed house sales, property values, buyer activity, selling times, rental growth and yields across 30 local suburbs.
The results show a market that remains strong, but is beginning to change.
Annual property value growth remains healthy across many Bundaberg suburbs, particularly through the established family areas close to town. However, the latest 60-day figures suggest buyers are taking longer, negotiating more and becoming increasingly selective.
In practical terms, Bundaberg is moving towards a more balanced property market, rather than experiencing a broad downturn.
Which Bundaberg suburbs are performing strongly?
Our analysis looked beyond house-price growth alone.
Each suburb was assessed using annual value growth, sales volume, days on market, rental yield, rental growth and the relationship between sales and available stock. Results were then adjusted to reduce the influence of suburbs with very few transactions.
The 10 highest-ranked Bundaberg suburb markets were:
- Bundaberg North
- Svensson Heights
- Walkervale
- Kepnock
- Bargara
- Bundaberg West
- Gooburrum
- Bundaberg South
- Norville
- Avoca
These results don’t mean every property in a higher-ranked suburb will outperform one in a lower-ranked suburb. Instead, they show where the strongest combination of growth, sales activity, buyer demand and rental fundamentals exists.
Bundaberg North leads the weighted results
Bundaberg North placed first in the weighted analysis.
The suburb recorded:
- Annual house value growth of 18.5%
- 111 house sales
- Median selling time of 14 days
- Reported value-based rental yield of 5.3%
That combination matters because the result isn’t based on price growth alone. Bundaberg North also has a meaningful number of sales and rental observations, giving us greater confidence in its overall market position.
Established family suburbs remain in demand
The market’s most consistent strength is appearing through established suburbs such as Walkervale, Svensson Heights, Norville, Kepnock, Millbank, Avoca, Avenell Heights and Thabeban.
Many of these areas offer the combination local buyers regularly look for, established homes, practical access to Bundaberg’s everyday services and a more approachable price point than the premium coastal market.
The data shows:
- Thabeban recorded a median selling time of 9 days
- Avenell Heights recorded 10.5 days
- Norville recorded 12 days
- Walkervale recorded 12.5 days
- Kepnock and Millbank each recorded 13 days
Importantly, most of these figures are supported by meaningful annual sales volumes. That makes this group one of the clearest indicators of ongoing owner-occupier demand across Bundaberg.
The coastal market is following a different path
The coastal corridor remains one of the most valuable parts of the wider Bundaberg real estate market.
The highest reported median house values were:
- Coral Cove, $1,001,115
- Innes Park, $985,034
- Bargara, $974,307
- Elliott Heads, $905,587
These markets also recorded a substantial concentration of sales above $800,000.
However, coastal property is behaving differently from the established suburbs closer to Bundaberg. Reported rental yields are generally lower, while selling periods are longer in several locations.
This doesn’t suggest the coast is weak. It shows that Bargara, Innes Park, Coral Cove and Elliott Heads attract a different mix of owner-occupiers, lifestyle buyers and premium purchasers.
Bargara remains particularly important because it recorded 206 house sales, the largest annual house-sales figure among the 30 suburbs analysed.
Where are Bundaberg’s strongest reported rental yields?
For landlords and property investors, the strongest reported value-based house yields were concentrated around the urban market:
- Bundaberg North, 5.3%
- Bundaberg West, 5.2%
- Bundaberg South, 5.1%
- Walkervale, 5.0%
- Svensson Heights, 5.0%
- Bundaberg East, 5.0%
Premium coastal values have generally moved ahead of rents, resulting in lower reported yields. That makes the urban core and established middle market particularly relevant when comparing value, rental income and market depth.
Yield is only one part of an investment decision. Property-specific expenses, vacancy, condition, maintenance, finance and tax aren’t reflected in a value-based gross yield.
What changed in the last 60 days?
The annual suburb data shows where the market has been, while the latest 60-day figures give us a clearer picture of current momentum.
Compared with the previous 60 days:
- New sale listings fell 19.76% to 597
- Recently advised sales fell 23.24% to 251
- Average days on market increased 18.74% to 64.95 days
- Average vendor discount reached negative 2.38%
- Withdrawn advice increased 3.32% to 404
- Total rental listings fell 5.43% to 592
Sales activity has fallen slightly faster than new listing activity. At the same time, properties are taking longer to sell and sellers are allowing more room for negotiation.
That suggests buyers are becoming more considered about price, presentation and value.
What does the Bundaberg market mean for sellers?
Annual property growth remains strong across much of Bundaberg, but the latest activity figures show that simply entering the market may no longer be enough.
Sellers should pay close attention to:
- Recent comparable sales in their immediate area
- Competing properties currently for sale
- Buyer feedback during the opening weeks
- Presentation and marketing quality
- Whether the asking price reflects current conditions, rather than an earlier stage of the market
Fast-moving suburbs still provide strong evidence of buyer demand. In slower coastal, acreage and prestige markets, sellers may need to allow for a smaller buyer pool and a longer decision-making process.
What does it mean for buyers?
Buyers may have more room to complete their due diligence and negotiate than the annual growth figures initially suggest.
However, conditions differ considerably by location.
Well-positioned homes in suburbs such as Thabeban, Avenell Heights, Norville, Walkervale and Kepnock have recorded short median selling periods. Waiting too long on a suitable property could still mean missing out.
The key is knowing the local market at street level, rather than relying on a single Bundaberg-wide figure.
The Bundaberg property market in one sentence
Bundaberg property values remain strong, but buyers are taking longer and negotiating harder, making local pricing and suburb knowledge increasingly important.
There isn’t one single Bundaberg market.
The family suburbs, urban investment areas, coastal corridor and acreage locations each have their own buyer pools, selling periods and price patterns.
If you want to understand what’s happening in your part of Bundaberg, tap into our street-by-street knowledge.
Need to know more? Let’s chat about your suburb, your street and what the latest local data could mean for your property.
You might also be interested in
Mar 4, 2026
2026 Bundaberg Median Sale Price hits $700,000!
BUNDABERG PROPERTY MARKET What the Data Says About Buying, Renting & Selling in 4670 If you're thinking about buying, selling, or renting property in Bundaberg (postcode 4670), the latest mark
Feb 19, 2026
What Would Halving the Capital Gains Tax Discount Mean for Bundaberg Property?
There has been growing discussion about the Australian Government potentially halving the Capital Gains Tax (CGT) discount on investment properties from 50% to 25%. If introduced, this would mark one